data analysis
2024-06-11

AI-assisted graphs and insights in 30 seconds!
Overview
data analysis#43 most recent
Most popular alternative: DataSquirrel (851 saves)
View all 100 alternatives
Recommendations
Generated by ChatGPT
**Your raw data is not sent to LLMs.**ChartPixel distinguishes itself with its AI-assisted data analysis and visualization capabilities. It's not just about graph generation; it's about generating actionable insights backed by statistics.
It's designed to be intuitive, eliminating the steep learning curve often associated with data analysis tools.
Instant Data Visualization:
Transform your data into visually appealing interactive charts and insights.
Data Cleaning and Feature Engineering:
Cleans messy data in your uploaded spreadsheets (Excel, CSV, and Google Sheets) and also creates new, valuable features.
AI and statistics-powered data insights:
Automatically selects relevant columns and chart types supported by AI-powered explained insights.
Variety of chart types:
Offers over twenty different chart types with explanatory insights.
One-click share & export:
Converts data insights into PowerPoint presentations, combining visual appeal with statistical accuracy. Upcoming features include dashboard publishing and exporting to Word & Excel.
Survey analysis backed by statistics:
Analyzes multi-select questions, performs in-depth segmentation analysis, supports abbreviating long column names, and performs comment & text analysis.
Keyword Search Tool:
Finds and transforms web data tables into charts.
Mobile optimized:
Get insights on the go.
ChartPixel is ideal for students, researchers, entrepreneurs, business professionals and data analysts who need to analyze and visualize data quickly and efficiently without the complexities of traditional data analysis tools.
Whether you are a beginner or a seasoned analytics professional, ChartPixel guides you through the data-driven journey effortlessly.
API is now available to show your analysis and graphs directly on your platform.
60
2
How would you rate ChartPixel?
Help other people by letting them know if this AI was useful.
Comments(2)

Tom Sutton
Mar 13, 2024
An incredibly impressive tool for analysis and visualization. Provided deep and sometimes surprising insights into my data I would not have considered previously. Can definitely recommend

Carlo Di Giulio
Dec 9, 2023
Easy to use, intuitive, and insightful at the same time. Great for data enthusiasts who need help to contextualize and combine info from multiple datasets.
Post
Feature requests
Are you looking for a specific feature that's not present in ChartPixel?
💡 Request a feature
ChartPixel was manually vetted by our editorial team and was first featured on August 16th 2023.
★★★★★
★★★★★
30
3
★★★★★
★★★★★
133

Turn ideas into software requirements, specifications, designs with Archie, AI Product Architect
★★★★★
★★★★★
257
100 alternatives to ChartPixel for data analysis
-
 8515
8515 -
 6611
6611 -
 2481
2481 -
 2035
2035 -
 1783
1783 -
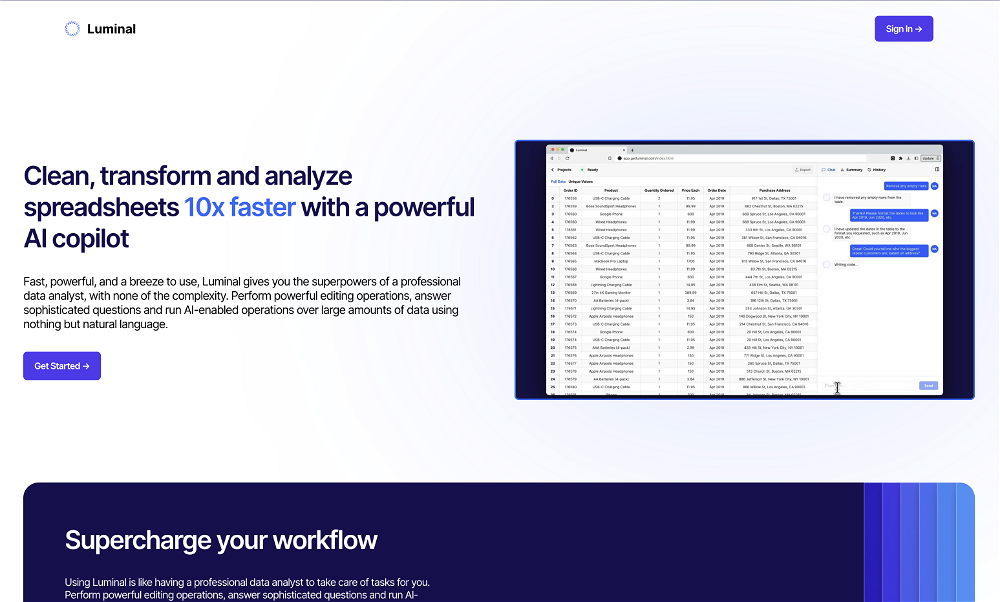
 Clean, transform and analyze spreadsheets 10x faster with a powerful AI copilot1211
 -
 104
104 -
 1021
1021 -
 85
85 -
 73
73 -
 72
72 -
 70
70 -
 686
686 -
 664
664 -
 66
66 -
 64
64 -
 591
591 -
 53
53 -
 53
53 -
 53
53 -
 53
53 -
 501
501 -
 48
48 -
 40
40 -
 35
35 -
 35
35 -
 33
33 -
 311
311 -
 281
281 -
 28
28 -
 282
282 -
 27
27 -
 27
27 -
 27
27 -
 27
27 -
 27
27 -
 261
261 -
 26
26 -
 26
26 -
 24
24 -
 23
23 -
 22
22 -
 221
221 -
 Turns a Datasette instance into a ChatGPT plugin to interrogate your data.21
 -
 21
21 -
 20
20 -
 Conversational AI Data Analyst: Simplifying Reporting, Amplifying Insights191
 -
 18
18 -
 18
18 -
 17
17 -
 17
17 -
 17
17 -
 17
17 -
 16
16 -
 16
16 -
 16
16 -
 16
16 -
 16
16 -
 16
16 -
 15
15 -
 15
15 -
 15
15 -
 15
15 -
 14
14 -
 14
14 -
 14
14 -
 14
14 -
 13
13 -
 13
13 -
 13
13 -
 13
13 -
 13
13 -
 12
12 -
 12
12 -
 12
12 -
 121
121 -
 12
12 -
 Unlock the potential of your data with Dxyfer's AI-based augmented intelligence tools.12
 -
 11
11 -
 11
11 -
 11
11 -
 11
11 -
 10
10 -
 10
10 -
 10
10 -
 10
10 -
 10
10 -
 10
10 -
 9
9 -
 91
91 -
 9
9 -
 9
9 -
 9
9 -
 91
91 -
 9
9 -
 9
9 -
 9
9 -
 8
8 -
 8
8 -
 8
8
View 86 more AIs


Pros and Cons
Pros
Instant visualization
Smart data analysis
PowerPoint presentations integration
Web data integration
Various data types support
Automates column selection
Handles messy data
Data features suggestion
Direct data to insights
Provides guidelines to data analysis
Supports multiple file formats
Automated insights ordering
One click export
Cloud database connectivity
Dynamic chart customization
Supports various chart types
Integrates keyword search tool
Automated data cleaning
Data exploration guidance
Provides data-driven insights
Automatic features engineering
Backed up by statistics
Online sharing options
Internet data search
User-friendly interface
Handles data anomalies
Automated data forecasts
Cleans missing values
Manages unit and currencies
Automates country codes
Mobile optimized
Manages unstructured data
Cons
No API mentioned
Limited chart customization
No offline mode
Limited data source integrations
Only exports to PowerPoint
No multi-language support
No details about scalability
Q&A
What is ChartPixel?
ChartPixel is a simplified chart generation and insights platform that leverages artificial intelligence to transform raw data into visually appealing and insightful charts. It demystifies the complexity of data analysis tools, providing an accessible way to understand and utilize data effectively. The platform can convert data insights into presentations like PowerPoint and integrates data from the web broadening analysis capabilities, regardless of the user's skill level.
How does ChartPixel help in visualizing data?
ChartPixel transforms data into charts through a process of instant visualization. It automatically converts uploaded data into an array of explained charts and summary insights, thereby enhancing comprehension. The platform cleans up messy data, identifies the most relevant columns, and suggests meaningful features to give a comprehensive interpretation of data.
What types of data can ChartPixel handle?
ChartPixel handles various types of data for different projects, including survey data, customer data, public data, business data, financial data, sports data, and research data. The source of the data can range from jot-down numbers, data files, webpages, or even links to databases.
How does Smart Data Analysis work in ChartPixel?
ChartPixel's Smart Data Analysis works by using AI algorithms to auto-select the most relevant columns for chart creation. It cleans up messy data and suggests meaningful features to provide a comprehensive interpretation of the data. The algorithm identifies patterns in the data and provides insight into the most important features.
Can ChartPixel convert data insights into PowerPoint presentations?
Yes, users can effortlessly convert the data insights generated by ChartPixel into visually impressive and statistically accurate PowerPoint presentations. This seamless transformation helps users craft compelling presentations without the need for advanced technical skills.
How does ChartPixel integrate web data?
ChartPixel integrates web data through a keyword search tool. Users can use this tool to find and integrate data from the web into stunning charts, thus broadening their analysis capabilities.
Does ChartPixel offer tutorials and blogs?
Yes, ChartPixel offers both tutorials and blogs to guide users to effectively use the platform for data visualization. These resources are available on the 'Learn' section of their website, and they provide both beginners and experienced users with valuable knowledge and insights to enhance their data visualization skills.
What types of files can be uploaded to ChartPixel?
ChartPixel supports the uploading of a variety of file types for data visualization. Users can upload Excel, CSV, JSON, or text files to automatically generate the best possible charts.
How does ChartPixel handle messy data?
ChartPixel handles messy data through its data cleaning functionalities. The platform automates the process of tidying up and enhancing data to create the most insightful charts. Problematic elements like missing values, irrelevant data, and poorly formatted information are automatically cleaned up, ensuring the quality of the data used for analysis.
Can I use keyword search in ChartPixel?
Yes, ChartPixel offers a keyword search tool that enables users to find and integrate data from the web. This tool enhances the user's ability to source relevant and context-specific data for their analysis, thereby broadening their analytical capabilities.
Can ChartPixel connect to a SQL database?
Yes, ChartPixel has the capacity to connect to a SQL database or file repositories such as Google or Microsoft for chart creation. This allows users to leverage larger and more complex datasets for their visualization purposes.
Does ChartPixel support mobile devices?
ChartPixel's website is not optimized for mobile devices yet. Users are encouraged to use a desktop or laptop for the best user experience.
How are charts explained and ordered in ChartPixel?
ChartPixel uses AI-assisted annotations to explain charts and order them based on their importance. This ensures the user understands the insights derived from their data and the relevance of each visualization generated.
Can you customize the charts generated by ChartPixel?
Yes, users can customize the charts generated by ChartPixel. Once the platform generates charts based on the insights from the data analysis, users are given further options to tailor the visualization to their specific needs.
How can ChartPixel help beginners in data analysis?
ChartPixel is designed to be user-friendly and intuitive for beginners in data analysis. It auto-selects the most relevant columns and chart types, cleans messy data, and creates interesting new features that guide users through the data analysis process. This integrated approach minimizes the need for technical expertise and steep learning curves.
What types of charts can ChartPixel generate?
ChartPixel offers over twenty different chart types to users, including charts, maps, animations, scatter plots, and more. The platform's intelligent analysis system selects the chart type that best represents the patterns and insights in the uploaded data to create intuitive and effective visualizations.
How does ChartPixel handle missing values in the data?
ChartPixel handles missing values in the data using sophisticated data cleaning algorithms. These algorithms automatically fill gaps and address inconsistencies in the data, ensuring a comprehensive and reliable analysis outcome.
Can you export the charts and insights from ChartPixel?
Yes, users can export charts and insights from ChartPixel into PowerPoint or Excel with a single click. This feature is designed to assist users in creating ready-made presentations or reports that accurately reflect their data analysis results.
How to share projects with ChartPixel?
Users can share their charts or publish their entire projects immediately with ChartPixel. The streamlined sharing and publishing feature makes it easier for users to disseminate their findings and engage with their audience.
Is it possible to embed the charts from ChartPixel on my website?
Yes, charts generated by ChartPixel can be embedded on websites. This makes it easy to share insights and visual data representations online, enhancing accessibility and convenience for both the user and their audience.
If you liked ChartPixel
Featured matches
-
Clean, transform and analyze spreadsheets 10x faster with a powerful AI copilot★★★★★★★★★★1211
Other matches
People also searched
scientific data analysiswebsite data analysisvisual data analysisthematic analysisquantitative data analysis using aigraph analysisfinancial data analysiscolor analysis in pdfapp performance analysisadsgenerate dashboardtext to infographicexcel dashboardchartpixelchartdata chartsinfographicsdata analysisdata visualizationcharts
Home
Search
My saved AIs
Free signup
Just Launched
Featured
Popular
Requests
Tasks
Timeline
Job Impact Index
Forum
Newsletter
Submit / Advertise

Join the biggest AI community
Subscribe to our exclusive newsletter, coming out 3 times per week with the latest AI tools. Join over 470,000 readers.
Help
⌘ + D bookmark this site for future reference
⌘ + ↑/↓ go to top/bottom
⌘ + ←/→ sort chronologically/alphabetically
↑↓←→ navigation
Enter open selected entry in new tab
⇧ + Enter open selected entry in new tab
⇧ + ↑/↓ expand/collapse list
/ focus search
Esc remove focus from search
A-Z go to letter (when A-Z sorting is enabled)
+ submit an entry
? toggle help menu
Sign in to continue (100% free)
To prevent spam, some actions require being signed in. It's free and only takes a few seconds.
Sign in with Google


0 AIs selected
Clear selection
#
Name
Task