 Flow - 4x faster than typing

 Mini tools





Grafana Assistant







Overview
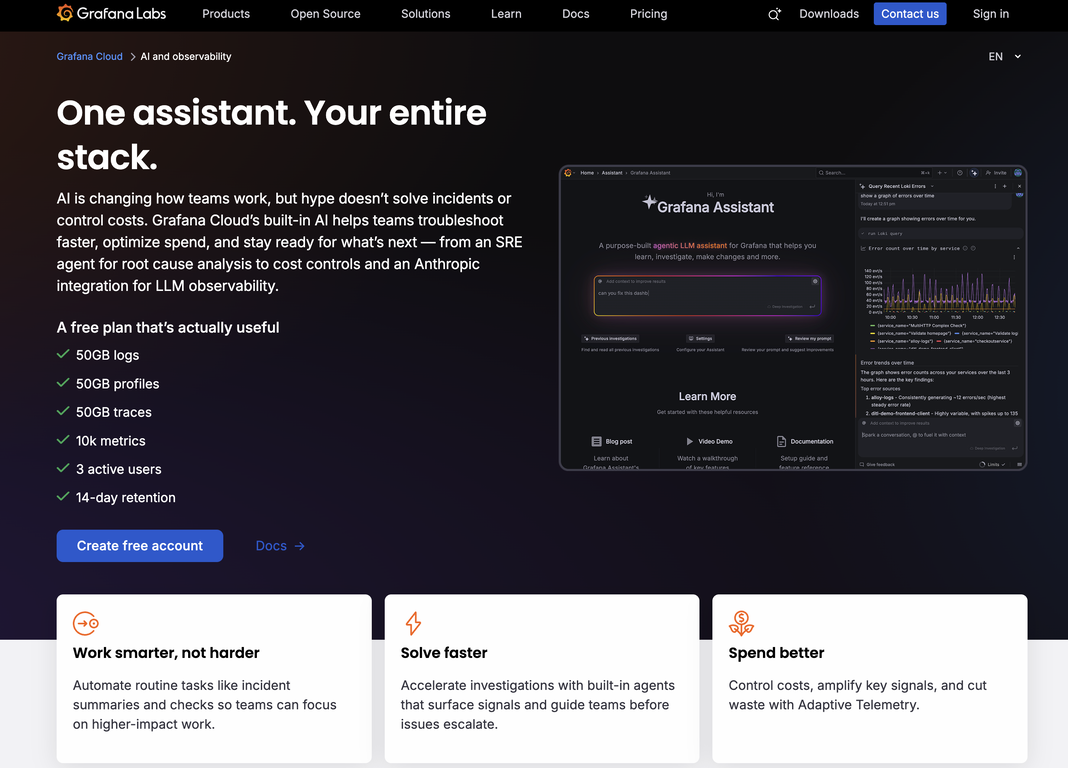
Grafana Cloud is an AI-powered observability tool designed to streamline the process of monitoring and analyzing team's data in real-time. It offers open-source solutions that enable you to monitor application performance and ensures infrastructure health.
With the provision of logging, visualization, tracing, and metrics capabilities, it helps in identifying anomalies, conducting root cause analysis, creating Service Level Objectives (SLOs), and triggering alerts.
It also offers comprehensive application performance monitoring, infrastructure observability, performance testing and synthetic monitoring. Grafana Cloud provides features for incident response and on-call management, automating routine tasks and ushering in flexible management during incidents.
Its solutions are designed to include monitoring integrations with technologies such as Linux, Windows, Docker, PostgreSQL, MySQL, AWS, Kafka, Jenkins, RabbitMQ, MongoDB, Microsoft Azure, and Google Cloud.
The platform supports a wide array of data sources and offers visualization integrations with MongoDB, AppDynamics, Oracle, GitLab, Jira, Salesforce, Splunk, Datadog, New Relic, and Snowflake among others.
Committed to enhancing the ease and speed of onboarding and minimizing vendor lock-in, it aims to help teams work smarter across the observability journey.
Releases
Top alternatives
-
 AI observability platform for building quality AI products.
 -
 AI-powered observability platform that predicts and prevents issues.
 -
 See inside any stack, any app, anywhere.
 -
 Observability for the AI era





How would you rate Grafana Assistant?
Help other people by letting them know if this AI was useful.