
aws / graph-explorer
React-based web application that enables users to visualize both property graph and RDF data and explore connections between data without having to write graph queries.
README
Graph Explorer
Graph Explorer provides a React-based web application that enables users to
visualize both property graph and RDF data and explore connections between data
without having to write graph queries. You can connect to a graph database over
HTTP that supports the
W3C RDF/SPARQL open standard, the
openCypher open source specification, or the open
source Apache TinkerPop Gremlin.
To get started, you can deploy Graph Explorer on a local machine using
Docker Desktop, or in the
cloud using Amazon EC2 or a container service
like Amazon ECS.
Getting Started
There are many ways to deploy and run Graph Explorer. If you are new to graph
databases and Graph Explorer, we recommend that you check out the
Getting Started guide.
- Local Docker Setup -
A quick start guide to deploying Graph Explorer locally using the official
Docker image. - Amazon EC2 Setup -
A quick start guide to setting up Graph Explorer on Amazon EC2 with Neptune. - Local Development -
A quick start guide building the Docker image from source code. - Troubleshooting - A collection of
helpful tips if you run in to issues while setting up Graph Explorer. - Samples - A collection of Docker Compose files that show various
ways to configure and use Graph Explorer.
Minimum Recommended Versions
Graph Explorer does not block any particular versions of graph databases, but
the queries used may or may not succeed based on the version of the query
engine.
For Neptune databases, we recommend
version 1.2.1.0
or above, which include the summary API and TinkerPop 3.6.2.
For non-Neptune databases, we recommend at least TinkerPop 3.6.
Features Overview
Graph Explorer offers a comprehensive set of tools for interacting with graph
databases:
- Connections - Create and manage connections to graph databases
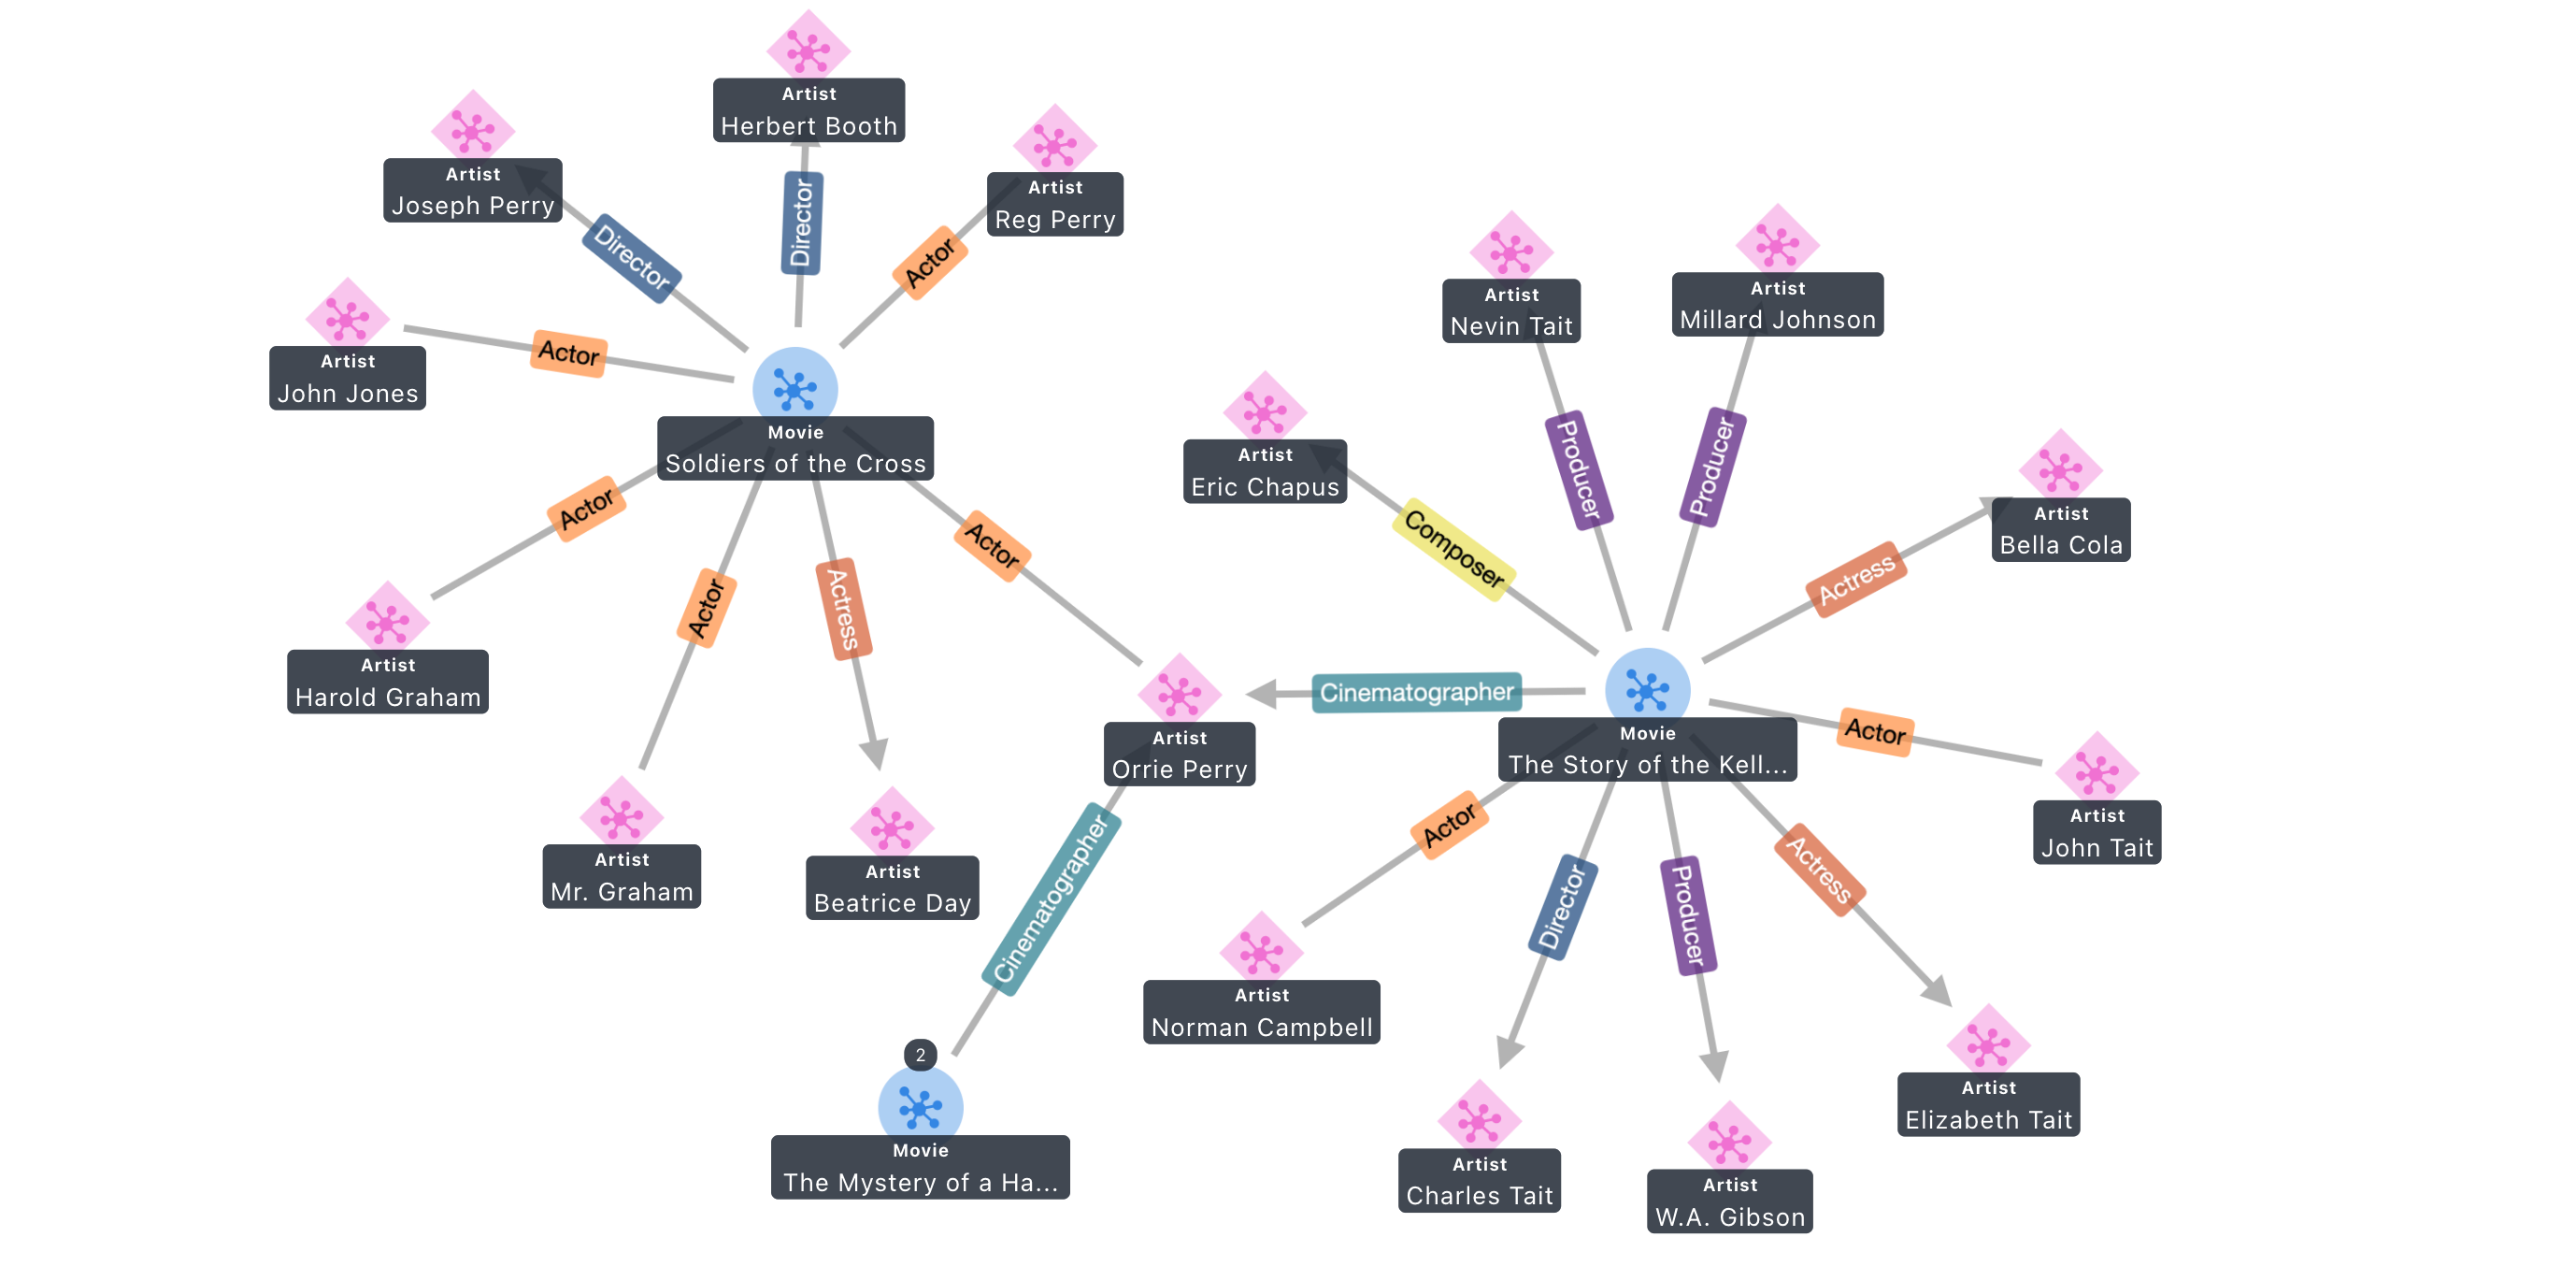
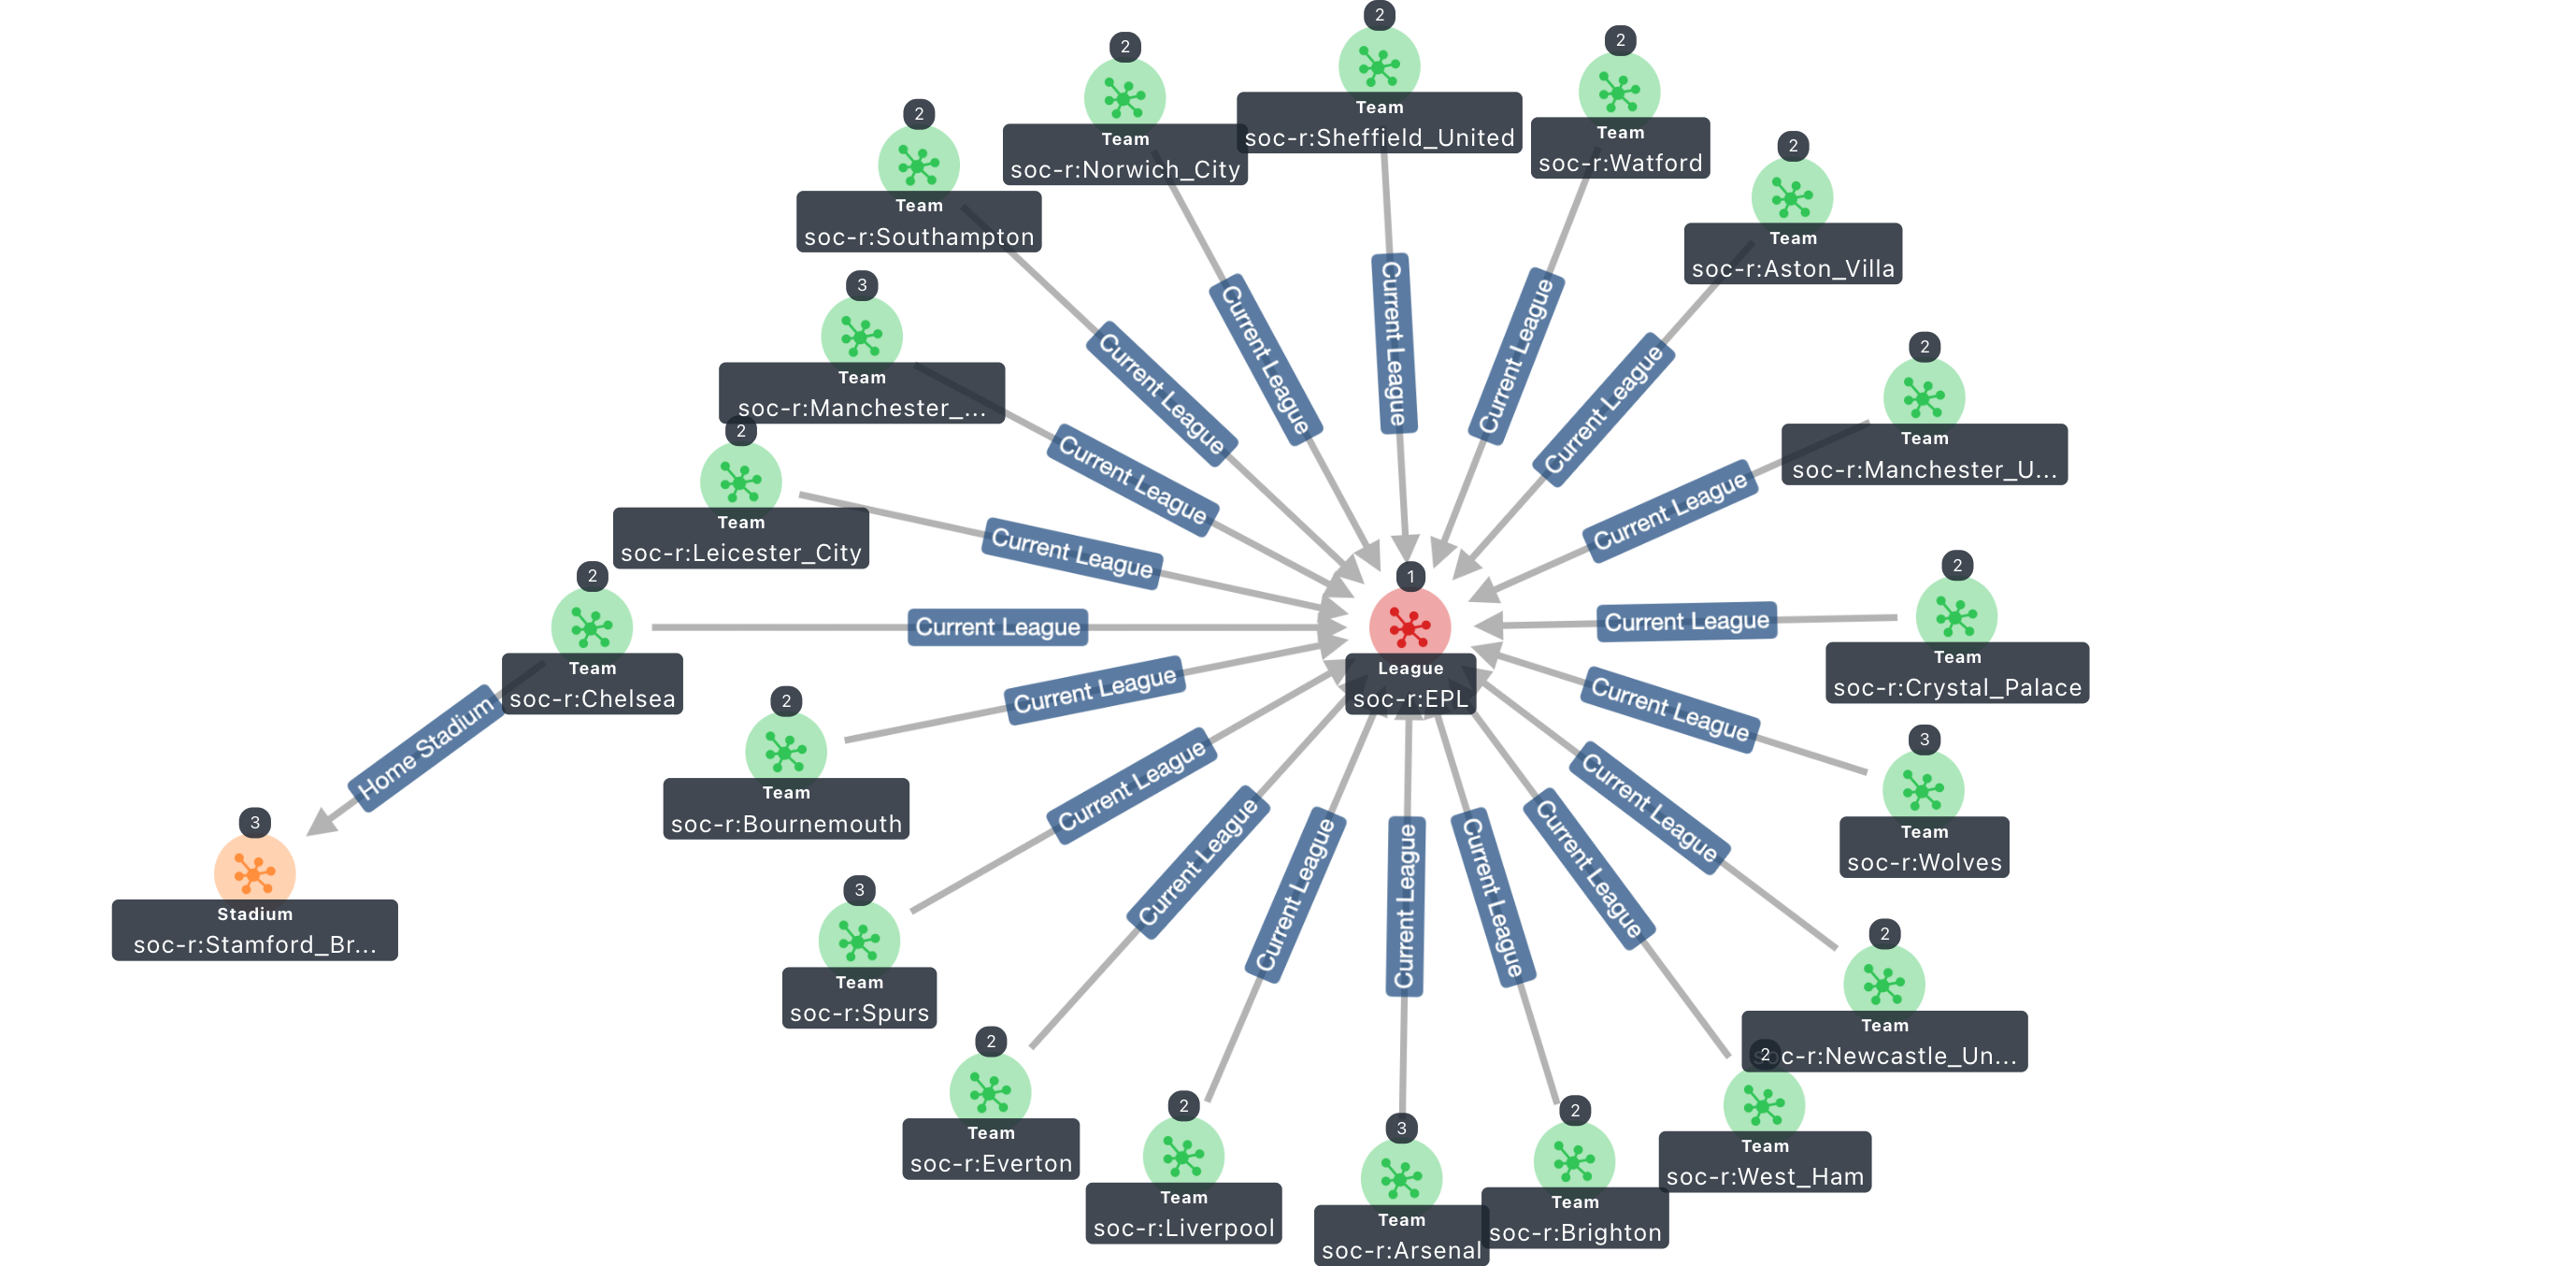
- Graph View - Visualize and interact with graph data through:
- Interactive graph visualization
- Powerful search capabilities
- Custom query execution and visualization
- Customizable styling options
- Detailed node/edge information
- Tabular View - Interact with nodes & edges that have been added to the
graph view- Show or hide individual nodes & edges
- Filtered nodes and edges will fade in the graph view
- Export table to CSV or JSON file
- Data Explorer - Examine specific node types and send nodes to the graph
view
For complete documentation on all features and functionality, please see our
detailed features guide.
If you're interested in our future development plans, check out our
roadmap and participate in the discussions.
Connections
Graph Explorer supports visualizing both property graphs and RDF graphs.
You can connect to Amazon Neptune or you can also connect to open graph
databases that implement an Apache TinkerPop Gremlin endpoint or the SPARQL 1.1
protocol, such as Blazegraph. For additional details on connecting to different
graph databases, see Connections.
Providing a Default Connection
To provide a default connection such that initial loads of Graph Explorer always
result with the same starting connection, modify the docker run ... command to
either take in a JSON configuration or runtime environment variables. If you
provide both a JSON configuration and environmental variables, the JSON will be
prioritized.
Environment Variables
These are the valid environment variables used for the default connection, their
defaults, and their descriptions.
- Required:
PUBLIC_OR_PROXY_ENDPOINT-None- See
Add a New Connection
- Optional
GRAPH_TYPE-None- If not specified, multiple connections will be
created for every available query language. See
Add a New ConnectionUSING_PROXY_SERVER-False- See Add a New ConnectionIAM-False- See Add a New ConnectionGRAPH_EXP_HTTPS_CONNECTION-True- Controls whether Graph Explorer uses
SSL or notPROXY_SERVER_HTTPS_CONNECTION-True- Controls whether the server uses
SSL or notGRAPH_EXP_FETCH_REQUEST_TIMEOUT-240000- Controls the timeout for the
fetch request. Measured in milliseconds (i.e. 240000 is 240 seconds or 4
minutes).GRAPH_EXP_NODE_EXPANSION_LIMIT-None- Controls the limit for node
counts and expansion queries.
- Conditionally Required:
- Required if
USING_PROXY_SERVER=TrueGRAPH_CONNECTION_URL-None- See
Add a New Connection
- Required if
USING_PROXY_SERVER=TrueandIAM=TrueAWS_REGION-None- See Add a New ConnectionSERVICE_TYPE-neptune-db, Set this asneptune-dbfor Neptune
database orneptune-graphfor Neptune Analytics.
- Required if
JSON Configuration Approach
First, create a config.json file containing values for the connection
attributes:
{
  "PUBLIC_OR_PROXY_ENDPOINT": "https://public-endpoint",
  "GRAPH_CONNECTION_URL": "https://cluster-cqmizgqgrsbf.us-west-2.neptune.amazonaws.com:8182",
  "USING_PROXY_SERVER": true,
  "IAM": true,
  "SERVICE_TYPE": "neptune-db",
  "AWS_REGION": "us-west-2",
  // Possible Values are "gremlin", "sparql", "openCypher"
  "GRAPH_TYPE": "gremlin",
  "GRAPH_EXP_HTTPS_CONNECTION": true,
  "PROXY_SERVER_HTTPS_CONNECTION": true,
  // Measured in milliseconds (i.e. 240000 is 240 seconds or 4 minutes)
  "GRAPH_EXP_FETCH_REQUEST_TIMEOUT": 240000,
  "GRAPH_EXP_NODE_EXPANSION_LIMIT": 500,
}
Pass the config.json file path to the docker run command.
docker run -p 80:80 -p 443:443 \
 --env HOST={hostname-or-ip-address} \
 -v /path/to/config.json:/graph-explorer/config.json \
 public.ecr.aws/neptune/graph-explorer
Environment Variable Approach
Provide the desired connection variables directly to the docker run command,
as follows:
docker run -p 80:80 -p 443:443 \
 --env HOST={hostname-or-ip-address} \
 --env PUBLIC_OR_PROXY_ENDPOINT=https://public-endpoint \
 --env GRAPH_TYPE=gremlin \
 --env USING_PROXY_SERVER=true \
 --env IAM=false \
 --env GRAPH_CONNECTION_URL=https://cluster-cqmizgqgrsbf.us-west-2.neptune.amazonaws.com:8182 \
 --env AWS_REGION=us-west-2 \
 --env SERVICE_TYPE=neptune-db \
 --env PROXY_SERVER_HTTPS_CONNECTION=true \
 --env GRAPH_EXP_FETCH_REQUEST_TIMEOUT=240000 \
 --env GRAPH_EXP_NODE_EXPANSION_LIMIT=500 \
 public.ecr.aws/neptune/graph-explorer
Development
For development guidance, see Development.
Security
You can use Graph Explorer to connect to a publicly accessible graph database
endpoint, or connect to a proxy endpoint that redirects to a private graph
database endpoint.
Graph Explorer supports the HTTPS protocol by default and provides a self-signed
certificate as part of the Docker image. You can choose to use HTTP instead by
changing the
environment variable default settings.
HTTPS Connections
If either Graph Explorer or the proxy-server are served over an HTTPS connection
(which it is by default), you will have to bypass the warning message from the
browser due to the included certificate being a self-signed certificate. You can
bypass by manually ignoring them from the browser or downloading the correct
certificate and configuring them to be trusted. Alternatively, you can provide
your own certificate. The following instructions can be used as an example to
bypass the warnings for Chrome, but note that different browsers and operating
systems will have slightly different steps.
- Download the certificate directly from the browser. For example, if using
Google Chrome, click the “Not Secure” section on the left of the URL bar and
select “Certificate is not valid” to show the certificate. Then click Details
tab and click Export at the bottom. - Once you have the certificate, you will need to trust it on your machine. For
MacOS, you can open the Keychain Access app. Select System under System
Keychains. Then go to File > Import Items... and import the certificate you
downloaded in the previous step. - Once imported, select the certificate and right-click to select "Get Info".
Expand the Trust section, and change the value of "When using this
certificate" to "Always Trust". - You should now refresh the browser and see that you can proceed to open the
application. For Chrome, the application will remain “Not Secure” due to the
fact that this is a self-signed certificate. If you have trouble accessing
Graph Explorer after completing the previous step and reloading the browser,
consider running a docker restart command and refreshing the browser again.
[!TIP]
To get rid of the “Not Secure” warning, see
Using self-signed certificates on Chrome.
Permissions
Graph Explorer does not provide any mechanisms for controlling user permissions.
If you are using Graph Explorer with AWS, Neptune permissions can be controlled
through IAM roles.
For information about what permissions Graph Explorer requires check out the
documentation on
SageMaker configuration.
[!CAUTION]
By default, a Neptune Notebook will have full read & write access to Neptune data.
Authentication
Authentication for Amazon Neptune connections is enabled using the
SigV4 signing protocol.
To use AWS IAM authentication, you must run requests through a proxy endpoint,
such as an EC2 instance, where credentials are resolved and where requests are
signed.
To set up a connection in Graph Explorer UI with AWS IAM auth enabled on
Neptune, check Using Proxy-Server, then check AWS IAM Auth Enabled and type in
the AWS Region where the Neptune cluster is hosted (e.g., us-east-1).
For further information on how AWS credentials are resolved in Graph Explorer,
refer to this
documentation.
Health Check Status
The graph-explorer-proxy-server provides a /status endpoint for monitoring
its health and readiness. This endpoint is crucial for ensuring reliable service
operation and can be utilized in various deployment scenarios.
Key Features:
- Health Check: The
/statusendpoint serves as a basic health check,
confirming that the Express server is running and responding. This is
essential for load balancers (like AWS ALB) to determine if the server is
operational and should receive traffic. - Readiness Probe: It also functions as a readiness probe in container
orchestration systems (like Kubernetes). This allows the orchestrator to know
when the server is ready to accept requests, preventing traffic from being
routed to instances that are still starting up or experiencing issues. - Expected Response: A successful health check or readiness probe will
result in an HTTP200 OKresponse with the body containingOK.
Logging
Logs are, by default, sent to the console and will be visible as output to the
docker logs. If you want to access the full set of logs, you can run
docker logs {container name or id}.
The log level will be set via the LOG_LEVEL env variable at
/packages/graph-explorer/.env where the possible options, from highest to
lowest, are error, warn, info, debug, and trace such that error is
the highest level and will only include logs labeled as errors and trace the
lowest and will include any type of log.
By default, the log level is set to info and the only type of logs generated
are those of error, info, or debug. If you need more detailed logs, you
can change the log level from info in the default .env file to debug and the
logs will begin printing the error's stack trace.
Within node-server.js, you'll notice three things.
- A
proxyLoggerobject - This is responsible for actually recording the logs. - An
errorHandler- This automatically sends errors to theproxyLoggerand
can log extra information by adding wanted text to the error object at a key
calledextraInfo. - An endpoint called
/logger- This is how you would log things from the
browser. It needs a log level and message header passed and you can then
expect to see the message logged at the provided log level.
Contributing Guidelines
See CONTRIBUTING for more information.
License
This project is licensed under the Apache-2.0 License.


