
microsoft / vscode-react-native
VSCode extension for React Native - supports debugging and editor integration
README
React Native Tools
Stable:


Preview:


React Native Tools Preview
The extension has a nightly version which is released on a daily basis at 9 PM PST on each day that changes occur.
To avoid conflicts, if both extensions are installed - only stable version will be activated. So to use the preview version it is needed to disable or remove the stable version and reload VS Code.
Package extension locally
You can not only download React Native Tools in the marketplace, but can also package your extension .vsix installation file by yourself locally. Following this documentation to package and install your React Native Tools to get the latest updates.
About the extension
This VS Code extension provides a development environment for React Native and Expo projects.
Using this extension, you can debug your code and quickly run react-native or expo commands from the command palette.
Table of Contents
- React Native Tools Preview
- Package extension locally
- About the extension
- Getting started
- React Native commands in the Command Palette
- Customize metro configuration
- Debugging React Native applications
- Hermes engine and direct debugging (Recommended)
- Attach to Hermes application
- Android applications
- iOS applications
- Expo applications
- Windows applications
- MacOS applications
- Monorepo: debug out of React Native project directory
- Debugger configuration properties
- Re.Pack and Haul debugging
- Remote JavaScript Debugging (Deprecated)
- Customization
- Sourcemaps
- Debug in vscode workspace
- Logging
- Build APK and generate bundle
- Specifying custom arguments for
react-native run-*command - Setting up the React Native packager
- Change project root
- Configure an Android LogCat Monitor
- Configure dependencies versions for debugging Expo projects
- Configure custom key bindings for extension commands
- Configure custom colors for extension output logs
- Set pnpm as package manager
- Element inspector (Deprecated)
- Network Inspector
- Developing inside a Docker Container
- Contributing
- Known Issues
Getting started
Before going any further make sure that you:
- have a working React Native environment.
- have the Android emulator available in your
PATHor install iOS simulator in MacOS - are using VS Code and have installed this extension from the Marketplace.
- have your React Native project root folder open in VS Code.
- have executed
React Native: Check development environment configurationorReact Native: Run expo doctorcommand to make sure that all necessary softwares are installed correctly.
Please notice that the extension uses .vscode/.react directory at the project root to store intermediate files required for debugging. Although these files usually get removed after debug session ends, you may want to add this directory to your project's .gitignore file.
React Native commands in the Command Palette
In the Command Palette, type React Native and choose a command.
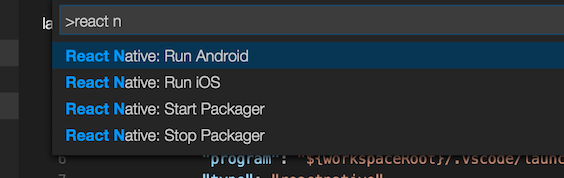
The Run Android or Run iOS command triggers react-native run-android or react-native run-ios to starts your app for Android emulator or iOS simulator.
The Run Expo command triggers expo start and starts your expo application.
The Packager commands allow you to start/stop the Metro Bundler (formerly React Packager).
The full list of commands is:
| Name | Command ID | Description |
|---|---|---|
| Launch Android Emulator | reactNative.launchAndroidSimulator |
Prompts you to select the name of the available Android emulator and launch it. If only one emulator is installed in the system, it will be selected automatically |
| Launch iOS Simulator | reactNative.launchIOSSimulator |
Prompts you to select the available system version of the iOS simulator, then select the simulator name for the selected system and launch it. If only one simulator is installed in the system, it will be selected automatically |
| Launch ExpoWeb | reactNative.launchExpoWeb |
Check if the current project is an Expo project. If so, launch ExpoWeb. |
| Run Android on Emulator | reactNative.runAndroidSimulator |
Run an Android application on Emulator. Launch order: check target platform support, load run arguments, start Packager, run app on the selected emulator. Make sure the emulator utility is added to PATH |
| Run Android on Device | reactNative.runAndroidDevice |
Run an Android application on Device. Launch order: check target platform support, load run arguments, start Packager, run app in all connected devices |
| Run iOS on Simulator | reactNative.runIosSimulator |
Run an iOS application on Simulator. Launch order: load run arguments, check target platform support, start Packager, run app in only one connected emulator |
| Run iOS on Device | reactNative.runIosDevice |
Run an iOS application on Device. Launch order: load run arguments, check target platform support, start Packager, run app in only one connected device |
| Run Expo | reactNative.runExponent |
Run an Exponent application. Launch order: login to exponent, load run arguments, start Packager, run app |
| Run Windows | reactNative.runWindows |
Run a RNW application. Launch order: check target platform support, load run arguments, start Packager, run app |
| Run MacOS | reactNative.runMacOS |
Run a RNmacOS application. Launch order: check target platform support, load run arguments, start Packager, run app |
| Start Packager | reactNative.startPackager |
Start Packager in context project workspace folder |
| Stop Packager | reactNative.stopPackager |
Stop Packager |
| Restart Packager | reactNative.restartPackager |
Restart Packager |
| Clean & Restart Packager (Metro) | reactNative.cleanRestartPackager |
Restart Packager and clear the Packager's cache |
| Publish To Expo | reactNative.publishToExpHost |
Publish to Exponent Host. Launch order: login to exponent, execute Run Expo command, then publish app to host |
| Expo - Create EAS config file | reactNative.createExpoEASBuildConfigFile |
Create EAS build config file for Expo projects |
| Show Dev Menu | reactNative.showDevMenu |
Show development menu for running application on iOS or Android device or emulator |
| ReloadApp | reactNative.reloadApp |
Reload an application |
| Run Element Inspector | reactNative.runInspector |
Load development tools for inspect application UI elements |
| Stop Element Inspector | reactNative.stopInspector |
Stop development tools for inspect application UI elements |
| Run React Native LogCat Monitor | reactNative.startLogCatMonitor |
Creates a LogCat Monitor for the chosen online Android device to see the device LogCat logs. Default filtering arguments: ["*:S", "ReactNative:V", "ReactNativeJS:V"]. How to configure filtering. |
| Stop React Native LogCat Monitor | reactNative.stopLogCatMonitor |
Stops an existing LogCat Monitor and removes its output channel |
| Run Network Inspector | reactNative.startNetworkInspector |
Run Network inspector |
| Stop Network Inspector | reactNative.stopNetworkInspector |
Stop Network inspector |
| Check development environment configuration | reactNative.testDevEnvironment |
Checks your development environment for common problems |
| Open the eas project in a web page | reactNative.openEASProjectInWebPage |
Open EAS build in your EAS project portal |
| Open react native upgrade helper in web page | reactNative.openRNUpgradeHelper |
Open an official project upgrade tools in browser, support RN, RN for Windows, RN for MacOS |
| Expo - Download and install ExpoGo | reactNative.installExpoGoApplication |
Download and install Expo Go application |
| Revert extension input in open package module | reactNative.revertOpenModule |
Quickly revert some codes in Open Module which are changed by react-native-tools |
| Run doctor | reactNative.doctor |
Execute react-native doctor to check basic environment for react-native development |
| Run expo doctor | reactNative.expoDoctor |
Execute expo doctor to check basic environment for Expo development |
| Expo prebuild | reactNative.expoPrebuild |
Create the android and ios directories for running your React code |
| Expo prebuild cleanup | reactNative.expoPrebuildClean |
Clean directories generated by prebuild |
| Reopen QR Code in Expo | reactNative.reopenQRCode |
Reopen expo generated QR code in webview |
| Enable Hermes | reactNative.hermesEnable |
Use hermes as JavaScript engine for RN project |
| Enable & Disable Expo Hermes | reactNative.expoHermesEnable |
Use hermes or jsc as JavaScript engine for expo project |
| Open expo upgrade helper in web page | reactNative.openExpoUpgradeHelper |
Open expo upgrade helper in web browser |
| Install CocoaPods dependencies | reactNative.installPods |
Install CocoaPods dependencies for iOS projects |
| Kill Port | reactNative.killPort |
Kill the process running on a specific port |
| Run EAS Build | reactNative.runEasBuild |
Initialize EAS Build configuration by creating eas.json and .eas/workflows/create-production-builds.yml files if they don't exist |
| Set React Native New Architecture | reactNative.setNewArch |
Enable or disable the new architecture settings in RN projects |
| Toggle Network View | reactNative.toggleNetworkView |
Enable or disable vscode network view feature for web debugging |
Using commands in VS Code tasks
To run React Native Tools commands via VS Code tasks, you can create a .vscode/tasks.json file in your project and add tasks configurations the following way:
{
  "version": "2.0.0",
  "tasks": [
    {
      "label": "Run Android on Emulator",
      "command": "${command:reactNative.runAndroidSimulator}",
      "problemMatcher": []
    }
  ]
}
Customize metro configuration
Metro is a JavaScript bundler for React Native and included in React Native package. Metro configuration can be customized in metro.config.js.
Debugging React Native applications
To debug react-native application:
- Create
launch.jsonfile in.vscodefolder. - Click on
Add Configurationbutton and chooseReact Nativeoption. - Select any scenario needed in dropdown list.
- Choose the appropriate configuration in the Configuration dropdown, and then press F5 (or click Green Arrow
 button) to start debugging your app in VS Code.
Optional: The extension also allows to start debugging without creating the launch.json file in one of the following ways:
-
Using dynamic debugging configurations
To use dynamic debugging configurations you can click on the
Show all automatic debug configurationsstring in theRun and Debugpanel, then selectReact Nativein the list of extensions and choose the appropriate configuration in the Configuration list to start debugging.
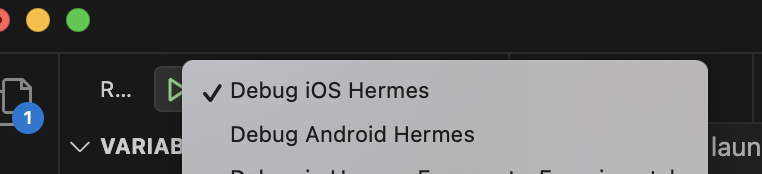
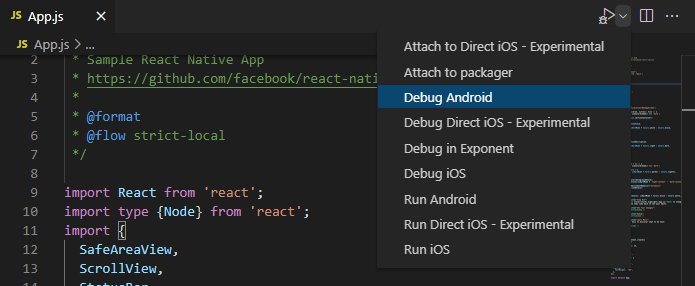
-
Using
Debugbutton in the Editor Title area menuTo start debugging you can click the Debug button in the Editor Title area in the upper right corner. You can also select the appropriate debugging scenario by clicking the dropdown button beside the Debug button and choosing the scenario.
The extension allows you to debug multiple devices and configurations, please read the following sections for more information for your particular use case.
Hermes engine and direct debugging (Recommended)
React-native set Hermes as default engine. Please see official documentation to get details.
The Hermes engine is an open source JavaScript engine created by Facebook to optimize building and running React Native applications. It improves app performance and decreases app size.
Click here to learn more about Hermes and how to enable it for your application.
Attach to Hermes application
To attach to a running Hermes application use Attach to Hermes application launch configuration:
{
  "name": "Attach to Hermes application",
  "cwd": "${workspaceFolder}",
  "type": "reactnativedirect",
  "request": "attach"
}
Android applications
Android Hermes debugging
To debug while using Hermes engine use Debug Android Hermes launch configuration:
{
  "name": "Debug Android Hermes",
  "cwd": "${workspaceFolder}",
  "type": "reactnativedirect",
  "request": "launch",
  "platform": "android"
}
Custom build for Android apps
If you want to use a custom applicationIdSuffix for your application to launch specific build, you can either pass it as part of the runArguments parameter arguments as shown below:
"runArguments": ["--appIdSuffix", "customAppIdSuffix", ...]
// or
"runArguments": ["--appIdSuffix=customAppIdSuffix", ...]
iOS applications
iOS Hermes debugging
To debug your iOS Hermes application, you can use Debug iOS Hermes launch configuration to debug an iOS Hermes application:
{
  "name": "Debug iOS Hermes",
  "cwd": "${workspaceFolder}",
  "type": "reactnativedirect",
  "request": "launch",
  "platform": "ios"
}
iOS devices
Debugging on an iOS device requires following manual steps:
- Install ios-deploy
brew install ios-deploy. - Install a valid iOS development certificate.
- In your project's
launch.jsonfile settargettodevice. If you need to specify the exact device to run, you can settargetto `, or you can also userunArgumentsproperty to specify a particular device to run on in case multiple devices are connected (e.g."runArguments": [ "--device", "My iPhone" ]`) - Choose the Debug iOS Hermes option from the "Configuration" dropdown and press F5.
Custom scheme for iOS apps
If you want to use a custom scheme for your application you can either pass it as part of the runArguments parameter arguments as shown below:
"runArguments": ["--scheme", "customScheme", ...]
// or
"runArguments": ["--scheme=customScheme", ...]
Please be aware, specifying the scheme value as a part of the runArguments parameter arguments will override the scheme configuration parameter value, if it set.
iOS direct debugging
The extension provides experimental support of iOS direct debugging. See more info here: react-native-community/discussions-and-proposals#40, react-native-community/discussions-and-proposals#206
For now the extension supports iOS direct debugging only on real iOS devices.
Since this scenarios are using some 3rd party tools for the debugging process. Sometimes it may have limitation from upstream. We still recommend using Hermes direct debugging as a first choice.
To be able to debug an iOS app directly, you need to install ios-webkit-debug-proxy:
- Install HomeBrew on your Mac.
- Open a Terminal and run
brew install ideviceinstaller ios-webkit-debug-proxy
You can use the following debug scenarios to debug iOS apps directly:
- React Native Direct: Debug Direct iOS - Experimental
    "name": "Debug Direct iOS - Experimental",
    "cwd": "${workspaceFolder}",
    "type": "reactnativedirect",
    "request": "launch",
    "platform": "ios",
    "port": 9221,
"target": "device"- React Native Direct: Attach to the React Native iOS - Experimental
    "name": "Attach to the React Native iOS - Experimental",
    "cwd": "${workspaceFolder}",
    "type": "reactnativedirect",
    "request": "attach",
    "platform": "ios",
    "port": 9221
Expo applications
Extension also support Expo application debugging scenarios.
To create Expo application, please prepare your environment by following the Expo CLI Quickstart instruction.
You can verify if the environment is ready to use by React Native: Run Expo Doctor in command palette.
Debug on Expo Go
If you're using Expo Go, follow below steps to start debugging Expo application:
- Open your project in VS Code with this extension installed.
- Add below configure in
launch.json.
{
  "name": "Debug Exponent Hermes",
  "request": "launch",
  "type": "reactnativedirect",
  "cwd": "${workspaceFolder}",
  "platform": "exponent",
  "expoHostType": "local"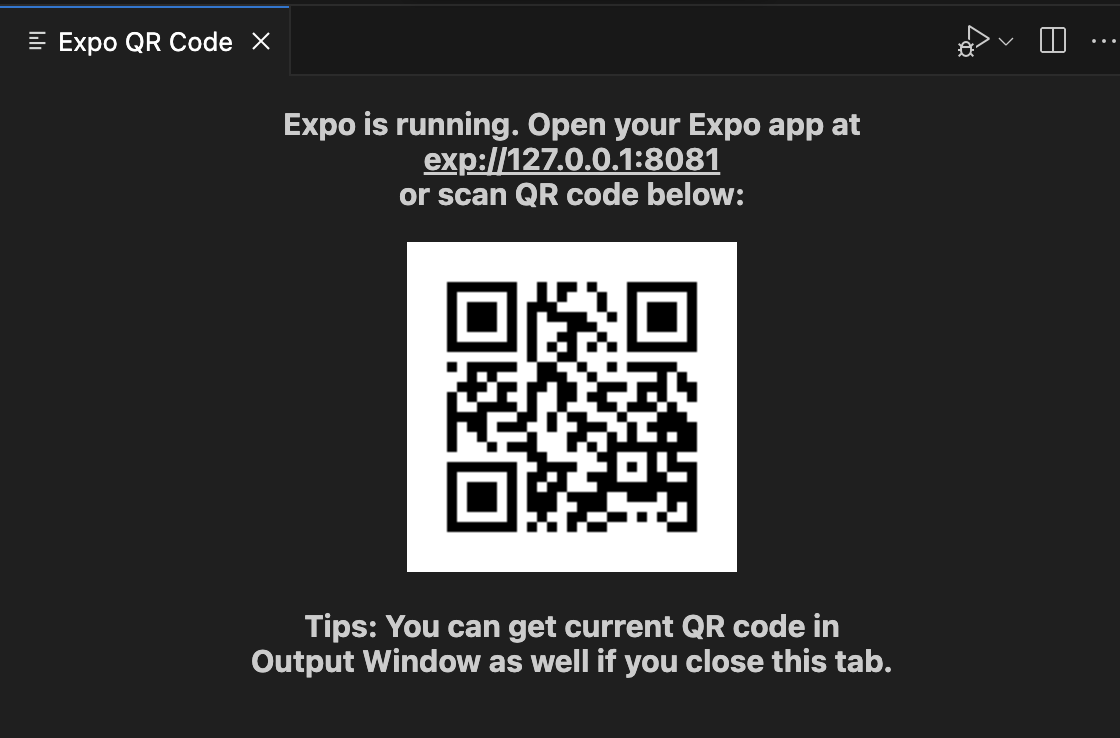
}- Wait while some dependencies are configured - the extension will install
Expo Development Library(xdl)when this feature is used for the first time. - Once the packager starts, the extension will open a separate tab with QR code and app link. You can open app in Expo Go and start debugging.
Debug on expo-dev-client
If you want to debug Expo app using expo-dev-client, follow below steps to start debugging Expo application:
- Open your project in VS Code with this extension installed.
- In project folder, install expo-dev-client for your app using
npx expo install expo-dev-client. - Create your app in development mode
eas build --profile development --platform all, replace--platform alltoandroidoriOSto build specific platform application(need development account foriOSplatform). - After build success, download your build and install application to your device or simulator.
- In project, using
npx expo start --dev-clientto start Metro and load application in device or simulator. - Add
Attach to applicationcommandlaunch.json, and start debugging.
{
  "name": "Attach to Hermes application",
  "request": "attach",
  "type": "reactnativedirect",
  "cwd": "${workspaceFolder}"
}
Debug on Expo Web
Expo support open application in browser, the expo web application is generated by react-native-web. It can help user open application without any Android emulator, iOS simulator or device. React-native-tools supports debugging Expo Web application in Chrome and Edge. Follow below steps to start Expo Web debugging:
- Open your project in VS Code with this extension installed.
- Check and install related package:
react-dom,react-native-weband@expo/webpack-config(this package is deprecated from Expo 49) bynpx expo installcommand. - Add Expo Web debugging configure in
launch.jsonand start debugging.
{
  "name": "Debug Expo Web",
  "request": "launch",
  "type": "reactnativedirect",
  "cwd": "${workspaceFolder}",
  "platform": "expoweb",
  "browserTarget": "chrome",
  "url": "http://localhost:8081"
}
Configuring Expo
The extension supports running through Exponent not just the applications created with Expo but even pure React Native applications (in that case you need to add expo package to node_modules in order to make it work with Expo: npm install expo --save-dev. In either cases it uses app.json configuration file in the root of the project.)
If you are running Debug Exponent Hermes configuration or any of palette commands like Run in Exponent, Publish to Exponent then this file will be created automatically if absent or updated with the following basic configuration section:
{
  "expo": {
    "slug": "MyApp", // Project slug
    "name": "MyApp", // Project name
    "sdkVersion": "31.0.0", // Expo SDK version
    "entryPoint": ".vscode\\exponentIndex.js" // Entrypoint for the project
  },
  "name": "MyApp" // Project name
}
Full list of configuration parameters for expo section in app.json may be found on official Expo documentation page.
For running pure React Native app, the extension, creates and uses .vscode/exponentIndex.js which points to the app entrypoint (index.js or index.android.js or index.ios.js) file.
If you want to change your app entrypoint (for example, from index.js to index.android.js), delete .vscode/exponentIndex.js and then restart your debugging session.
NOTE: The extension caches the version of the exponent SDK used by your project. This is helpful since we don't want to install the SDK each time you run exponent. If you want the extension to update the SDK version based on your React Native version, just restart VS Code and if it is supported it should work. If it does not please open an issue.
Expo Hermes
Expo using Hermes as default engine, you can switch engine on a specific platform using below configure.
{
  "expo": {
    "jsEngine": "hermes",
    "ios": {
      "jsEngine": "jsc"
    }
  }
}Note: You maybe need to create developer account to run eas build. Any other issue or limitation, please see expo hermes documentation.
EAS Build initialization
The Run EAS Build command (reactNative.runEasBuild) helps you quickly set up Expo Application Services (EAS) Build configuration in your Expo project.
What it does
When you run this command from the Command Palette (Ctrl+Shift+P or Cmd+Shift+P), it will:
- Check if your project root directory is accessible
- Create an
eas.jsonfile (if it doesn't exist) with an empty configuration{} - Create the
.eas/workflows/directory structure - Generate a
create-production-builds.ymlworkflow file with the following content:
name: Create Production Builds
jobs:
  build_android:
    type: build # This job type creates a production build for Android
    params:
      platform: android
  build_ios:
    type: build # This job type creates a production build for iOS
    params:
      platform: ios
How to use
- Open your Expo project in VS Code
- Press
Ctrl+Shift+P(Windows/Linux) orCmd+Shift+P(macOS) to open the Command Palette - Type "Run EAS Build" and select React Native: Run EAS Build
- The command will create the necessary files if they don't exist
Note: The command is idempotent - it will not overwrite existing files. If the files already exist, the command will skip creation and display an appropriate message.
Next steps after initialization
After running this command, you should:
-
Configure
eas.json: Add your build profiles (e.g.,development,preview,production). See EAS Build Configuration for details. -
Set up credentials: Configure your iOS and Android signing credentials. Use
eas credentialscommand or configure them in your EAS project. -
Run your first build:
# For Android npx eas build --platform android # For iOS npx eas build --platform ios # For both platforms npx eas build --platform all -
Customize workflows: Edit
.eas/workflows/create-production-builds.ymlto add more complex build configurations, such as different build profiles, environment variables, or custom scripts. -
Monitor builds: Use
React Native: Open the eas project in a web pagecommand to view your build status in the EAS dashboard.
Troubleshooting
- Permission errors: Ensure VS Code has write permissions to your project directory
- Files already exist: The command will skip file creation if they already exist - this is normal behavior
- Project not found: Make sure you have opened a React Native/Expo project folder in VS Code
For more information about EAS Build, visit the official Expo documentation.
React Native for Windows
Please make sure that your development environment is configured properly in accordance with the official system requirements.
And follow the official guide to enable Hermes engine for a Windows application.
Windows Hermes debugging
To debug React Native for Windows applications, you can use below configure in launch.json:
{
  "name": "Debug Windows Hermes",
  "cwd": "${workspaceFolder}",
  "type": "reactnativedirect",
  "request": "launch",
  "platform": "windows"
}
Also you can attach running application using Attach to Hermes application configuration to .vscode/launch.json in your project.
React Native for MacOS
Please make sure that your development environment is configured properly in accordance with the official system requirements.
And follow the official guide to enable Hermes engine for a macOS application.
MacOS Hermes debugging
To debug a macOS Hermes application you can use Debug macOS Hermes debugging scenario:
{
  "name": "Debug macOS Hermes",
  "request": "launch",
  "type": "reactnativedirect",
  "cwd": "${workspaceFolder}",
  "platform": "macos"
}
Also you can attach running application using Attach to Hermes application configuration to .vscode/launch.json in your project.
Monorepo: debug out of React Native project directory
If you're using monorepo like:
monorepo/
├── apps/
│   ├── app1/
│   │   └── src/
│   └── app2/
│       └── src/
├── packages/
│   ├── ui/
│   │   └── src/
│   └── common/
│       └── src/
│           └── utils.ts
└── package.json
When you import utils.ts in your project. Using
import { commonFunction } from "../../packages/common/src/utils";Will get error when start Metro:
error: bundling failed: Error: Unable to resolve module `../../packages/common/src/utils` from `src/App.js`To debug your code in monorepo, please follow below steps:
- In
metro.config.js, add extra module and watch folder.
const extraNodeModules = {
  common: path.resolve(__dirname + "/../packages/common/src"),
};

const watchFolders = [path.resolve(__dirname + "/../packages/common/src")];

const config = {
  resolver: {
    extraNodeModules,
  },
  watchFolders,
};- Import function in application.
import { functionInUtils } from "common/utils";or
import { functionInUtils } from "../../packages/common/src/utils";- Set source map override config in
launch.json. Example:
/* Get source map url from vscode debug diagnostics tab */
"sourceMapPathOverrides": {
    "/[metro-watchFolders]/1/*": "/Monorepo-Project-Full-Path/*",
}- Launch app and attach debugger
Debugger configuration properties
The following is a list of all the configuration properties the debugger accepts in launch.json:
| Name | Description | Type | Defaults |
|---|---|---|---|
cwd |
The path to the project root folder | string |
${workspaceFolder} |
sourceMaps |
Whether to use JavaScript source maps to map the generated bundled code back to its original sources | boolean |
true |
sourceMapPathOverrides |
A set of mappings for rewriting the locations of source files from what the source map says, to their locations on disk. See Sourcemaps for details | object |
n/a |
sourceMapRenames |
Whether to use the "names" mapping in sourcemaps. This requires requesting source content, which could slow debugging | boolean |
false |
enableDebug |
Whether to enable debug mode. If set to "false", an application will be launched without debugging | boolean |
true |
webkitRangeMin, webkitRangeMax |
Combines to specify the port range that you want the ios-webkit-debug-proxy to use to find the specific device described in the Direct iOS debug configuration | 9223, 9322 | |
trace |
Logging level in debugger process. May be useful for diagnostics. If set to "Trace" all debugger process logs will be available in Debug Console output window |
string |
log |
address |
TCP/IP address of packager to attach to for debugging | string |
localhost |
port |
Port of packager to attach to for debugging | string |
8081 |
remoteRoot |
The source root of the remote host | string |
null |
localRoot |
The local source root that corresponds to the 'remoteRoot' | string |
${workspaceFolder} |
skipFiles |
An array of file or folder names, or glob patterns, to skip when debugging | array |
[] |
debuggerWorkerUrlPath |
Path to the app debugger worker to override. For example, if debugger tries to attach to http://localhost:8081/debugger-ui/debuggerWorker.js and you get 404 error from packager output then you may want to change debuggerWorkerUrlPath to another value suitable for your packager (\"debugger-ui\" will be replaced with the value you provide) | string |
debugger-ui/ |
platform |
The platform to target. Possible values: android, ios, exponent, windows |
string |
n/a |
target |
Target to run on. Possible values: simulator, device, , [](https://github.com/react-native-community/cli/blob/master/docs/commands.md#--deviceid-string), `. If the value issimulatorordevicethen the quick pick window will be expanded with the names of the available virtual or physical targets, then, in case there are more than one available target with specified type, the target value inlaunch.jsonwill be changed to the name or id of the selected target. If you have only one target with specified type available, it will be selected automatically. If you're using Android emulator targets, please, make sure theemulatorutility is added toPATH|string|simulator` |
||
logCatArguments |
Arguments to be used for LogCat (The LogCat output will appear on an Output Channel). It can be an array such as: [":S", "ReactNative:V", "ReactNativeJS:V"] |
array |
["*:S", "ReactNative:V", "ReactNativeJS:V"] |
runArguments |
Run arguments to be passed to react-native run- command (override all other configuration params) |
array |
n/a |
launchActivity |
The Android activity to be launched for debugging, e.g. it specifies --main-activity parameter in react-native run arguments |
string |
MainActivity |
expoHostType |
The connection type to be used on Expo debugging to communicate with a device or an emulator. Possible values: |
tunnel- allows to deploy and debug an application by means of Expo cloud serviceslan- allows to deploy and install an application via your LANlocal- allows to debug an application on an emulator or an Android device without network connection
|string|lan|
|env| Environment variables passed to the debugger andreact-native run-command |object|{}|
|envFile| Absolute path to a file containing environment variable definitions |string|${workspaceFolder}/.env|
|variant| A variant to be passed toreact-native run-android, e.g. usedevDebugto specify--variant=devDebug|string| n/a |
|scheme| A scheme name to be passed toreact-native run-ios, e.g.devDebugto specify--scheme=devDebug|string| n/a |
|productName| iOS bundle display name e.g.AwesomeProjectvalue means that the extension will search forAwesomeProject.appbundle |string| n/a |
|jsDebugTrace| Enable trace collection for depended extensionvscode-js-debug|boolean| n/a |
Re.Pack and Haul debugging
Re.Pack: A modern bundler for React Native applications, powered by Rspack and Webpack.
Haul: A command line tool for developing React Native apps. Legacy tools, recommend using Re.Pack.
Both Re.Pack and Haul can use Attach request to attach to a react-native based app and debug it.
Add config in launch.json file as below, make sure adding sourceMapPathOverrides argument to update source map for your application webpack.
For example:
{
  "name": "Attach to Hermes application",
  "request": "attach",
  "type": "reactnativedirect",
  "cwd": "${workspaceFolder}",
  "sourceMapPathOverrides": {
    "webpack:///./~/*": "${workspaceRoot}/node_modules/*",
    "webpack:///./*": "${workspaceRoot}/*",
    "webpack:///*": "*"
  }
}
Remote JavaScript Debugging (Deprecated)
Remote JavaScript debugging is deprecated by react-native team from 0.73 and may be removed officially at any time.
We strongly recommend to use Hermes engine and direct debugging in your application.
Below config showed classic debug mode in extension. With the version update of react-native, some features of Remote JavaScript Debugging may become unavailable, we will remove it from extension in the future if it's totally removed officially.
{
  "name": "Debug Android",
  "request": "launch",
  "type": "reactnative",
  "cwd": "${workspaceFolder}",
  "platform": "android"
}
Customization
The extension can be further customized for other React Native scenarios. These are the most common:
Sourcemaps
The debugger uses sourcemaps to let you debug with your original sources, but sometimes the sourcemaps aren't generated properly and overrides are needed. In the config we support sourceMapPathOverrides, a mapping of source paths from the sourcemap, to the locations of these sources on disk. Useful when the sourcemap isn't accurate or can't be fixed in the build process.
The left hand side of the mapping is a pattern that can contain a wildcard, and will be tested against the sourceRoot + sources entry in the source map. If it matches, the source file will be resolved to the path on the right hand side, which should be an absolute path to the source file on disk.
Below there are some examples of how sourcemaps could be resolved in different scenarios:
// webRoot = /Users/me/project
"sourceMapPathOverrides": {
    "webpack:///./~/*": "${webRoot}/node_modules/*",       // Example: "webpack:///./~/querystring/index.js" -> "/Users/m


