

▼ Top rated
Data visualization tool
Free mode
100% free
Freemium
Free Trial
Featured matches
-
 cui meili🙏 22 karmaJun 9, 2025@Patsnap EurekaIt greatly supported my R&D work by helping me tackle technical challenges and prepare reports.
 -
 👋 Hey, I'm the founder of Flowova! We built this because we were tired of spending hours dragging boxes in traditional flowchart tools. A few things you might not know: - Works with anything — text, images, PDFs, Word, PPT, Excel, even photos of whiteboard sketches - 40+ themes designed for presentations - Full Mermaid code support for developers Happy to answer any questions! 🚀
 -

-

-
-
 This is truly a wonderful experience that brings joy and delight.
 -

-
 If you don't offer any free trial credits or at least show videos without a watermark, no one will feel confident enough to purchase credits without testing it first. People need to verify the quality before committing to a purchase.
 -
 Says "free during testing," but keeps telling me I have insufficient credits. I also can't seem to find a way to delete my account.


Other tools
-
Displayr has become an essential tool for survey data analysis. By leveraging advanced AI integration, the platform offers a user-friendly, low-code solution for analyzing survey data. Users can efficiently create presentations while working on data analysis within the same interface, eliminating the hassle of transferring numbers from Excel to PowerPoint.
- Sponsor:Rocket
-
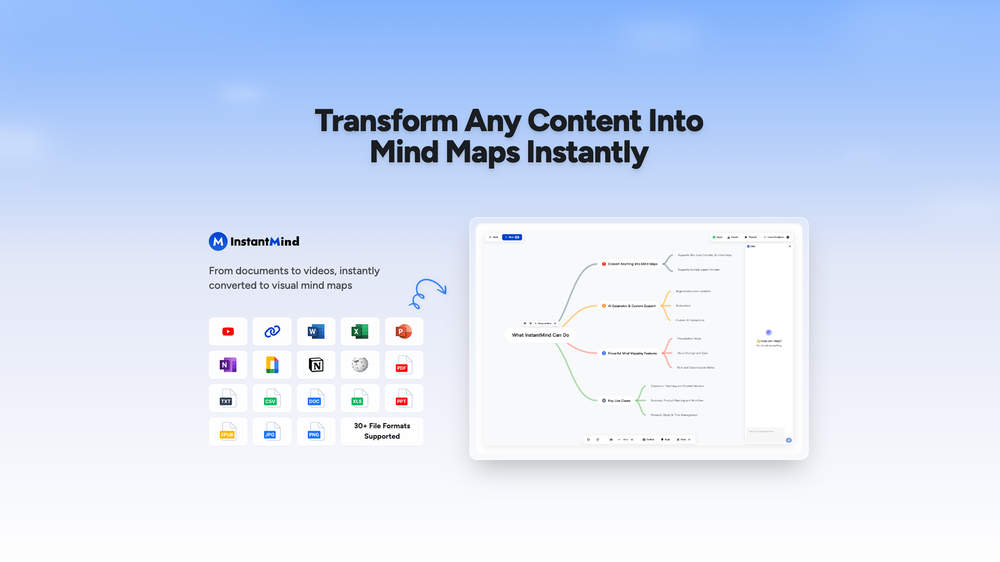
I am able to summarize a complex paper into a one-pager visual. Before this tool: hours of reading and summarizing. After this tool: I grasp something complex in seconds. Thank you!!!
-
-
Probably the most fun way to explore a topic, powered by GPT. Albus is a live board that will help you explore any topic you like in new ways, from different perspectives. Think of it as Google meets Pinterest.
- Didn't find the AI you were looking for?
-
impressive :O quite easy to use and great designs overall
-
I felt there is need of more ready made templates. But, it does what it claims. I chose one question suggested by the AI agent, and it created the infographics in few seconds. It's cool. Saving it for future reference.
-
 Ask data questions, get instant insights, SQL, and charts — all poweredOpen
 -
Isn't it possible that when downloading a diagram from it, the diagram to have white background rather than black background.
-
 Bring history to life with AI-generated visualizations.Open


Post


