

▼ Top rated
Graph analysis
Free mode
100% free
Freemium
Free Trial
Featured matches
-
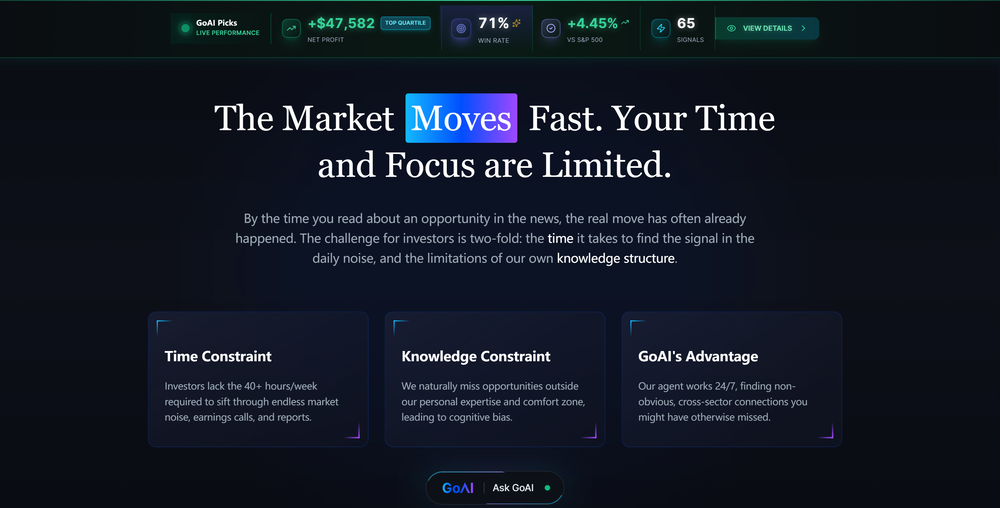
 GoAI🛠️ 1 tool 🙏 10 karmaJan 21, 2026@GoAIGoAI turns market noise into transparent, actionable investment logic. Go check your favorite stock for an instant deep-dive and see what the AI reveals. Feedback welcome!
 -

Other tools
-
InLinks is absolutely amazing for content optimization, internal linking and schema . I love how it prompts you to optimize for the entities/topics Google recognizes, not just keywords. The internal linking automation saves several hours every month especially with the RSS feed that automatically adds links to your blog as you post new content. All round brilliant tool!
-
- Sponsor
 Rocket - Think it. Type it. Launch it.
 -
-
As a UX Researcher - this is an amazing tool to rank and classify various user comments and feedback.
-
Isn't it possible that when downloading a diagram from it, the diagram to have white background rather than black background.
- Didn't find the AI you were looking for?
-
-
 Create stunning hand-drawn flowcharts from text instantly.OpenI use AI Flowchart Generator to create flowcharts for my blog posts. It’s incredibly easy to use and saves me so much time. Now, I can turn my text to flowchart and make my posts more interesting and helpful for readers!
 -
nice! does exatly what i wanted it to do, takes text, makes a nice looking diagram.
-
-
I can't help but rave about this product because of the level of craftsmanship in it; Vizly is made for data scientists, by data scientists, and it shows. Having tried various tools in the space, I can confidently say it's the best by a mile, the UX is silky smooth and will feel familiar to any data scientist, and yet it manages to supercharge your workflows - I gurantee you'll be a few times more productive, can't recommend it enough.
-
This one was really nice. In that it could also generate a white paper to go with the diagram
-
I wasn't able to use this one (I have my API key)
-
I was just trying to get a quick graph showing population evolution over the last 30 years, didn’t have the dataset ready, so I was hoping the tool could auto-fill something reasonable. But it literally gave me three values. Three?? For 30 years?? What kind of trend can I possibly see with that? If the tool offers to research the data, it should at least offer a full timeline. And when I pasted the data I found, it created a literally bar chart???
-


Ask the community

R W
🙏 1 karma
Feb 25, 2025
i want to upload a graph for analysis
Post


