
Graphy app
Overview
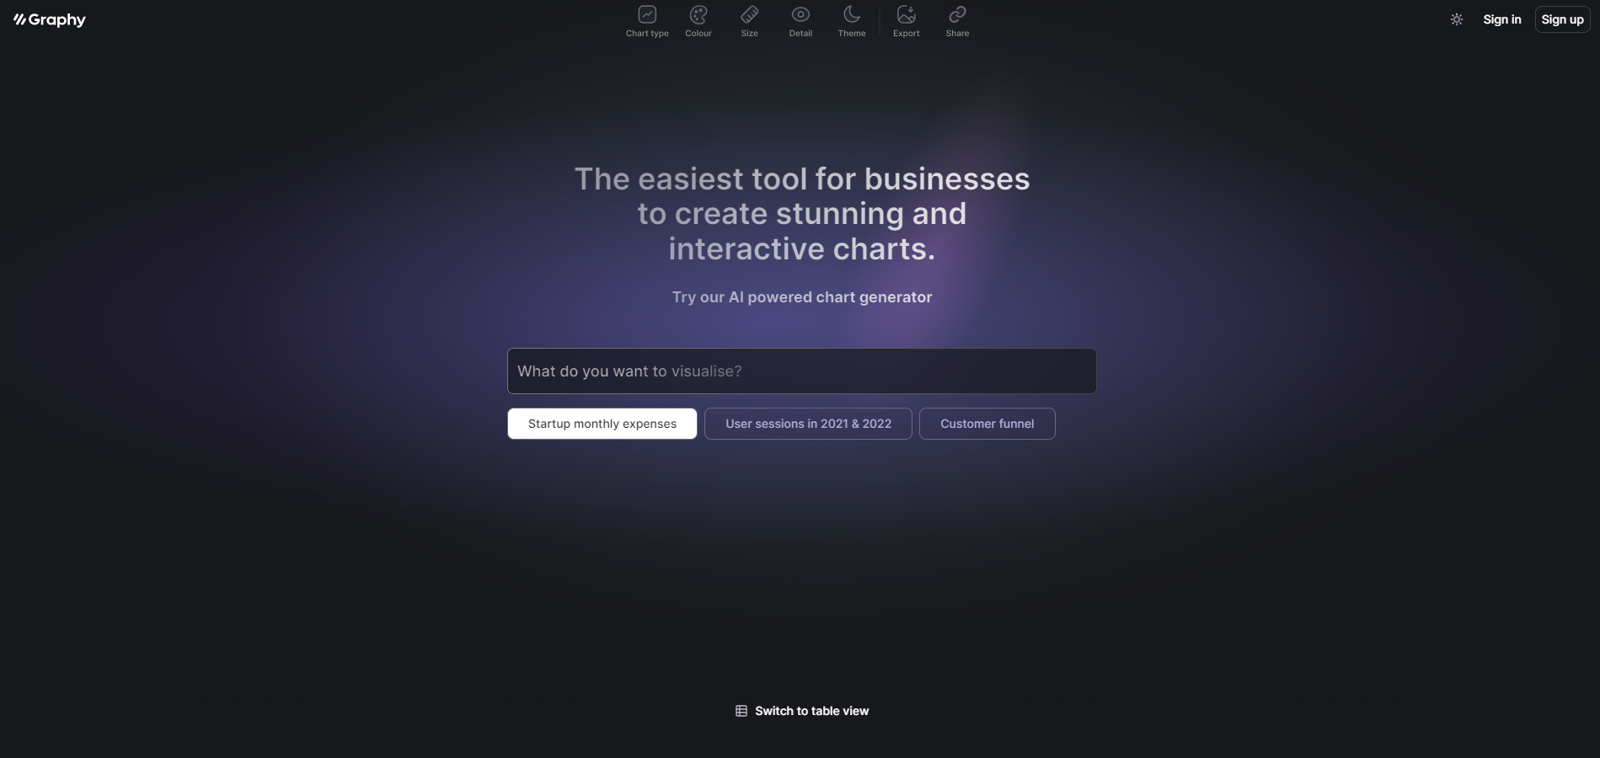
Graphy is a free chart-maker tool that allows businesses to easily create slick and interactive data visualizations. With the help of artificial intelligence, this tool enables users to generate stunning charts without the need for advanced technical skills.
The charts can be embedded into various platforms, including Notion and other preferred applications.By utilizing Graphy, businesses can effectively present their data in a visually appealing and engaging manner.
The tool offers a range of chart options, allowing users to showcase different types of data, such as startup monthly expenses, user sessions in specific time frames, and customer funnel analysis.
Users also have the option to switch to a table view for a more concise representation of their data.Graphy prioritizes user convenience by providing a simple and intuitive interface, making it accessible to individuals with varying levels of technical expertise.
This allows businesses to save time and resources that would otherwise be spent on manual chart creation or the hiring of specialized personnel. Moreover, the AI-powered capabilities of the tool assist users in generating charts quickly and accurately.Overall, Graphy is an efficient and user-friendly tool that empowers businesses to create visually impactful data visualizations.
By utilizing its features, businesses can effectively present their data, gain insights, and make informed decisions.
Releases

Pricing
Top alternatives
-
 Bring your ideas to life with a visual copilotJobin Mathew🙏 126 karmaJan 17, 2025@NapkinI recently started using Napkin AI, and I couldn't be more impressed! This tool is incredibly user-friendly and intuitive, making it easy to generate clear visual representations from text. Moreover, the interface is clean and visually appealing, which enhances the overall user experience. Napkin AI is a fantastic companion. Highly recommended for anyone looking to elevate their creative process!
 -
 Create charts instantly with natural language.
 -
 Transform data into professional charts in seconds.
 -
 Create any chart instantly with AIGreat tool for getting some initial information about your data, especially in the beginning phase when your main goal is to explore your data
 -
 Transform economic data into hand-drawn visualizations.
 -
 Generate AI tools instantly with pie chart


