
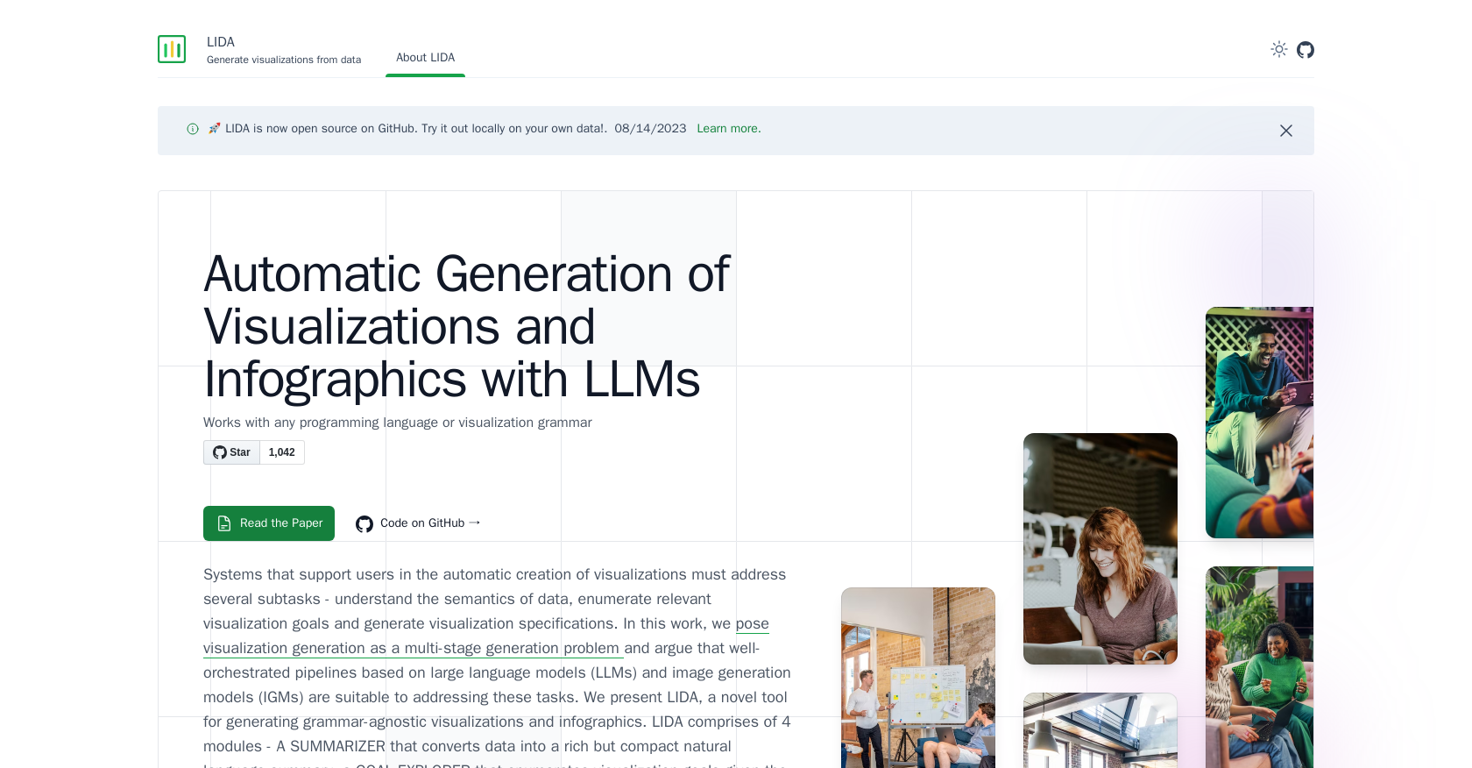
Overview
LIDA is a powerful tool that automates data exploration and generates visualizations and infographics using large language models (LLMs) like ChatGPT and GPT4.
It provides a conversational interface for automatic generation of grammar-agnostic visualizations from data. LIDA consists of four modules: the Summarizer, which converts data into a compact natural language summary; the Goal Explorer, which enumerates visualization goals based on the data; the VisGenerator, which generates, refines, executes, and filters visualization code; and the Infographer, which produces data-faithful stylized graphics using image generation models.LIDA is compatible with any programming language or visualization grammar, allowing users to create visualizations in Python (e.g., Altair, Matplotlib, Seaborn), R, C++, and more.
It also offers operations on existing visualizations, such as visualization explanation, self-evaluation, automatic repair, and recommendation.The tool supports various capabilities, including data summarization, automated data exploration, grammar-agnostic visualizations, and infographics generation.
It leverages the language modeling and code-writing capabilities of LLMs, enabling core automated visualization capabilities. LIDA also provides operations on generated visualizations, such as visualization explanation, self-evaluation, visualization repair, and visualization recommendations.LIDA's architecture combines LLMs and image generation models (IGMs) to address the multi-stage generation problem of visualization creation.
It is open-source and offers a Python API and a hybrid user interface for interactive chart, infographic, and data story generation.While LIDA has limitations with visualization grammars not well-represented in the LLM's training dataset and performance variations depending on the choice of visualization libraries and code generation capabilities, it remains a powerful tool for automating the visualization generation process.
Releases
Pricing
Other tools by Microsoft
-
 Marshmallowfroggy🙏 46 karmaFeb 22, 2024@Bing CreateIt's absolutely stunning how accurate it transforms your prompts into images, thanks to Dall-e 3. You have 15 boosts, after that image creation takes longer. You can create 30 images per day. You can organize your creations in gallery folders. However, the restrictions are insane, they filter out too many words / combinations of words. If you use words that are filtered, it will block your prompt, but won't tell you which word of your prompt it was. After several tries that resulted in a blocked prompt, you will be banned. This can mean for an hour, a day,... or permanently. If your prompt is OK, the AI will start to generate the images but if the created images are considered 'unsafe content', as the AI created something that could be considered offensive, it won't show you the resulting images. This is really annoying, you can't even create an image with several people in swimwear on a beach, it will generate only one person in swimwear, the other ones are wearing street wear for modesty or decency, I guess. But a single person in swimwear at a beach is ok. The logic behind that doesn't make sense. This could be way better if it would at least tell you the blocked words or mark them. And if you could decide for yourself if you want to see the created 'unsafe' images anyway.
 -
quick to pick up, slick results. turned my prompts into clean logo drafts n poster layouts fast; pixel-art style worked after a couple tweaks. wish it had true vector export and tighter font control, but for fast art ideas it’s great. 5/5

Top alternatives
-
 Smart insights for business, stunning visuals for creators.I felt there is need of more ready made templates. But, it does what it claims. I chose one question suggested by the AI agent, and it created the infographics in few seconds. It's cool. Saving it for future reference.
 -
 Turn raw data into instant visual insights.
 -
 Turn Data into Stunning Charts in SecondsI was just trying to get a quick graph showing population evolution over the last 30 years, didn’t have the dataset ready, so I was hoping the tool could auto-fill something reasonable. But it literally gave me three values. Three?? For 30 years?? What kind of trend can I possibly see with that? If the tool offers to research the data, it should at least offer a full timeline. And when I pasted the data I found, it created a literally bar chart???
 -
 Make Better Decisions with Data-Driven Charts, Clear Explanations, and Insightful Analysis
 -
 Turn complex data into clear insights with AI.
 -
 Supercharge Power BI dashboards with AI-driven insights


