Dashboards 2024-03-14
Instachart icon

Instachart

No ratings
21
Transforming sketches and screenshots into interactive dashboards.
Generated by ChatGPT

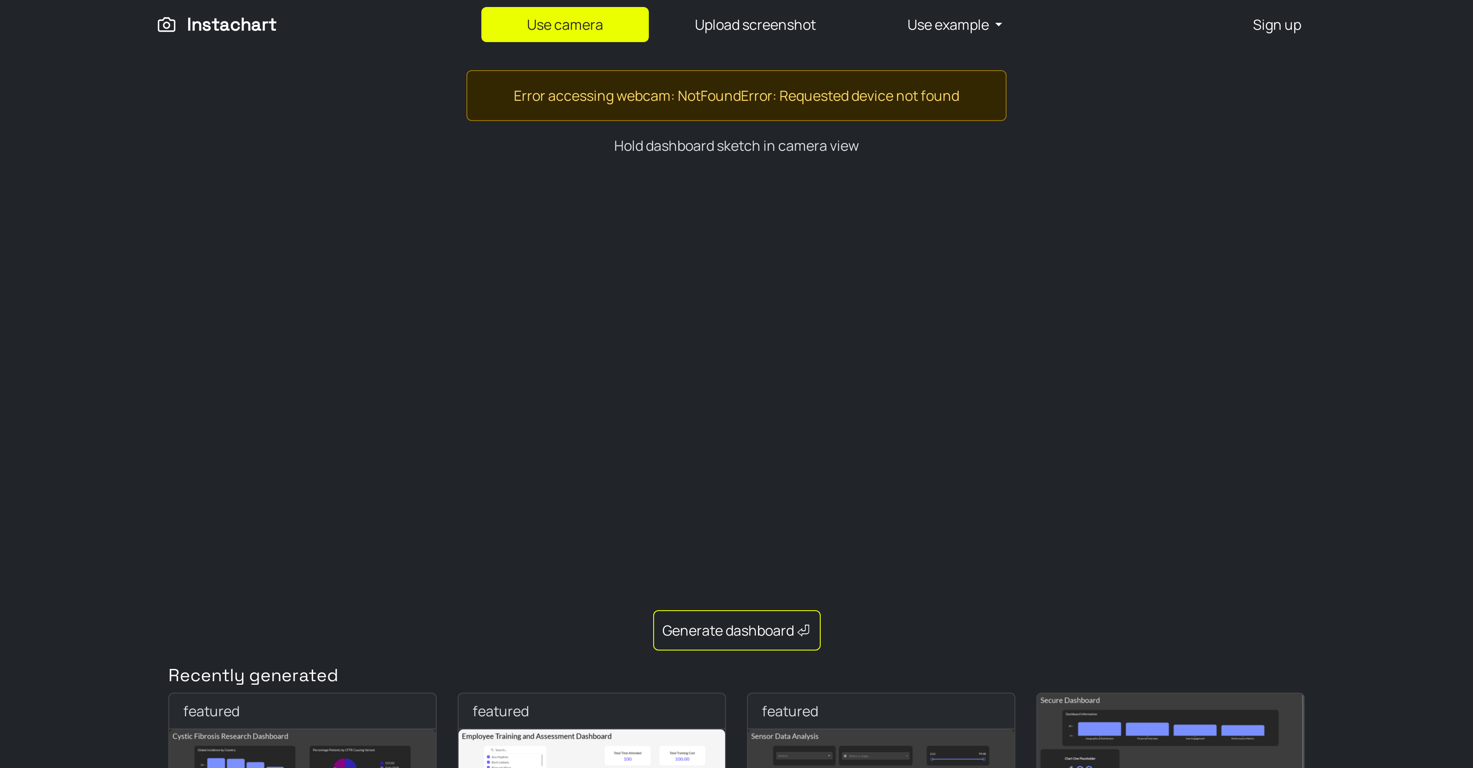
Instachart is a tool designed to quickly turn sketches, mockups, and screenshots into interactive Luzmo dashboards. It provides seamless functionality compatible with various modes of input.

Users can upload visuals or utilize the device's camera to capture sketches and images. These inputs are then transformed, generating interactive dashboards that grant more in-depth and accessible analysis of data.

This tool covers a wide range of uses as demonstrated by their featured dashboards which include, but not limited to, cystic fibrosis research, employee training and assessment, sensor data analysis, and retail sales.

Users can view these dashboards to glean insights and interpret complex data. The ease of accessibility and use make it a powerful tool for data visualization and analysis.

The tool encapsulates the essence of intuitive design and functionality, making it suitable for a diverse range of sectors and applications.

Save

Would you recommend Instachart?

Help other people by letting them know if this AI was useful.

Post

Feature requests

Are you looking for a specific feature that's not present in Instachart?
Instachart was manually vetted by our editorial team and was first featured on March 14th 2024.
Promote this AI Claim this AI

9 alternatives to Instachart for Dashboards

Pros and Cons

Pros

Transforms sketches into dashboards
Converts screenshots to dashboards
Upload functionality for visuals
Camera usage for inputs
In-depth data analysis
Accessible data interpretation
Diverse sector application
Used for cystic fibrosis research
Used in employee training
Used in sensor data analysis
Applied in retail sales
Intuitive design
Sign up functionality
Feature-rich dashboards
Interactive Luzmo dashboards
Mocks conversion
Multi-mode input compatibility
Handles complex data insights

Cons

Limited to Luzmo dashboards
No API mentioned
Upload visuals only
Can't handle video inputs
Device-specific camera usage
No multiple dashboard types
No real-time data
No customization options

Q&A

What is Instachart?
How does Instachart work?
What types of data can be visualized using Instachart?
How to upload visuals in Instachart?
Can I use the device's camera to input sketches into Instachart?
What applications does Instachart cover?
How does Instachart handle cystic fibrosis research data?
How can Instachart be used for employee training and assessment?
Does Instachart support sensor data analysis?
Can Instachart be used for retail sales analysis?
What makes Instachart suited for diverse sectors and applications?
How does Instachart transform sketches and screenshots into interactive dashboards?
Is there an error option if webcam is not found in Instachart?
How does Instachart assist in data analysis?
What are the features of Instachart's Luzmo dashboards?
Can I sign up into Instachart?
Does Instachart offer example data for practice?
How to generate a dashboard in Instachart?
What are some recently generated dashboards in Instachart?
What is the 'Creating your dashboard' function Powered by Luzmo in Instachart?

People also searched

Help

⌘ + D bookmark this site for future reference
⌘ + ↑/↓ go to top/bottom
⌘ + ←/β†’ sort chronologically/alphabetically
↑↓←→ navigation
Enter open selected entry in new tab
⇧ + Enter open selected entry in new tab
⇧ + ↑/↓ expand/collapse list
/ focus search
Esc remove focus from search
A-Z go to letter (when A-Z sorting is enabled)
+ submit an entry
? toggle help menu
βœ•
0 AIs selected
Clear selection
#
Name
Task