
ChatViz
Overview
ChatViz is a tool designed to strengthen data visualization capabilities using ChatGPT. It possesses two core features. The first, an SQL translator, takes user input commands and rapidly creates the matching SQL queries.
This streamlines the interaction between the user and their SQL database, as it lowers the necessity for extensive SQL knowledge. The second feature is an automated chart generator that can suggest charts most suited to a specific dataset provided by the user.
This feature simplifies the process of selecting the most appropriate data representation format. Using ChatViz can improve user experience during data visualization and hastens the implementation process.
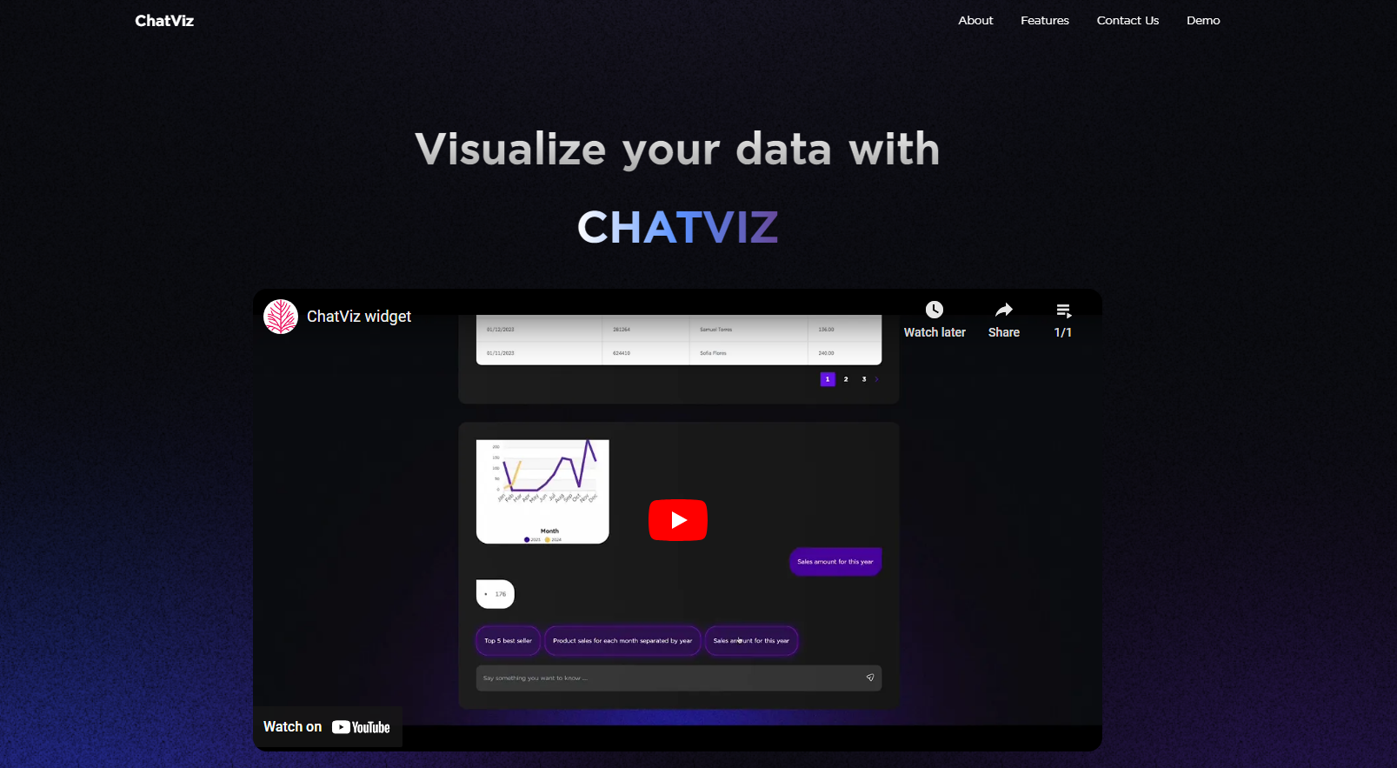
Offering a solution to the often faced dashboard complexity, it introduces a novel way to visualize data. The tool consists of a configurable ChatViz widget.
To use this tool, the user needs to configure their SQL schema to ChatViz and set up a webhook to communicate with ChatViz. After doing so, ChatViz will visualize the output data from the webhook.
This approach aims to decrease development time by automating the process of data visualization.
Releases
Top alternatives
-
 Smart insights for business, stunning visuals for creators.Harrison Oliver🙏 24 karmaJun 12, 2025@StatPeckerI felt there is need of more ready made templates. But, it does what it claims. I chose one question suggested by the AI agent, and it created the infographics in few seconds. It's cool. Saving it for future reference.
 -
 Turn raw data into instant visual insights.
 -
 Turn Data into Stunning Charts in SecondsI was just trying to get a quick graph showing population evolution over the last 30 years, didn’t have the dataset ready, so I was hoping the tool could auto-fill something reasonable. But it literally gave me three values. Three?? For 30 years?? What kind of trend can I possibly see with that? If the tool offers to research the data, it should at least offer a full timeline. And when I pasted the data I found, it created a literally bar chart???
 -
 Make Better Decisions with Data-Driven Charts, Clear Explanations, and Insightful Analysis
 -
 Generate visualizations from data using AI
 -
 Turn complex data into clear insights with AI.


