

▼ Top rated
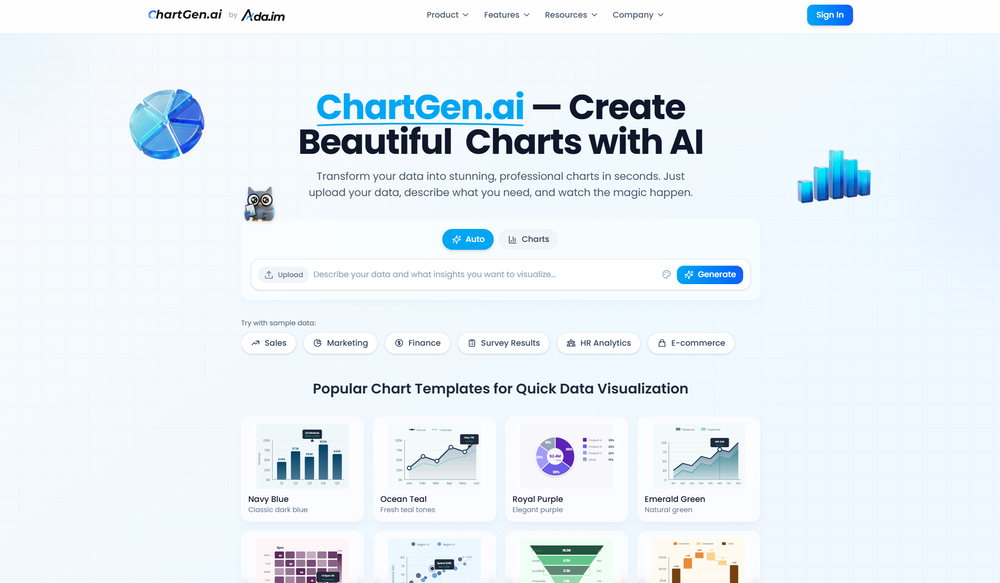
Generate graph
Free mode
100% free
Freemium
Free Trial
Featured matches
-
 Will Mitchell🛠️ 1 tool 🙏 11 karmaDec 19, 2025@ChartGenlooks awesome - congrats!
 -
-
 AI infographic generator that turns blog posts into link magnetsOpen
Other tools
- Spotlight: CodeRabbit (Code reviews)
-
I had to tweak a few things to match my brand style, but overall it saved me a ton of time. Definitely handy if you need something fast and professional-looking.
-
-
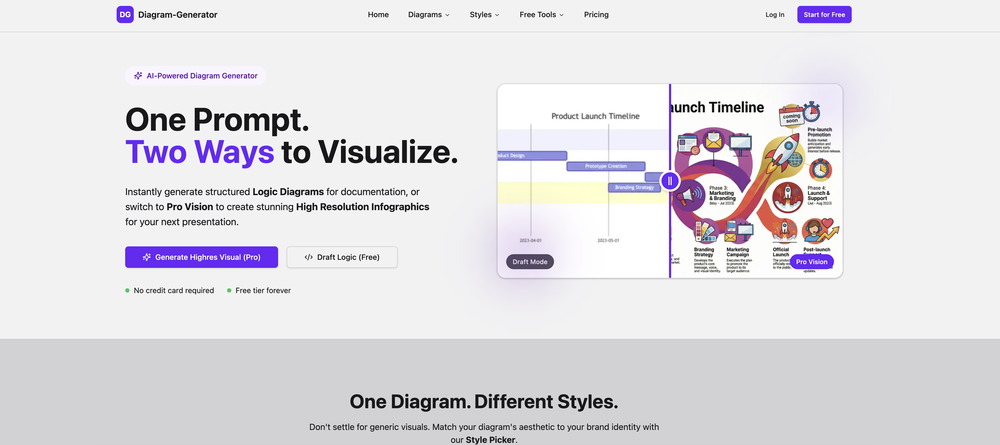
 Create stunning hand-drawn flowcharts from text instantly.OpenI use AI Flowchart Generator to create flowcharts for my blog posts. It’s incredibly easy to use and saves me so much time. Now, I can turn my text to flowchart and make my posts more interesting and helpful for readers!
 -
asking for key, no usability without a paid subscription
-
I got some free credits to try the app when I signed up, I could create a few great infographics
-
nice! does exatly what i wanted it to do, takes text, makes a nice looking diagram.
-
- Didn't find the AI you were looking for?
-
I wasn't able to use this one (I have my API key)
-
I was just trying to get a quick graph showing population evolution over the last 30 years, didn’t have the dataset ready, so I was hoping the tool could auto-fill something reasonable. But it literally gave me three values. Three?? For 30 years?? What kind of trend can I possibly see with that? If the tool offers to research the data, it should at least offer a full timeline. And when I pasted the data I found, it created a literally bar chart???
-
Great tool for getting some initial information about your data, especially in the beginning phase when your main goal is to explore your data
-
they support exporting to multi-sites now. got a lot of other improvements too, it's pretty great.
-
Dumber than a box of hair. Asked for a break even analysis chart. Fed it clear fixed costs, variable costs, net operating income AND ROI percentages. Even hinted that the break even point was between years six and seven. Dude took five minutes to draw a line across the "0" plane labeled "costs" and a revenue line crossing through where I suggested the break even point is. The scale was between 0.2-1.6 USD. No, I am not running a business for ants.
-
 Open
Open


Post


