

▼ Popular
Technical analysis chart reading
Free mode
100% free
Freemium
Free Trial
Featured matches
-
29,169367Released 1y agoFree + from $13.90/mo
 Builder🙏 122 karmaSep 27, 2024@MarketAlerts.aiIdeal for stock-watchlist and not missing trade setups that correspond to my strategy.

Other tools
-
26,525205v1.3 released 7mo agoFree + from $5/moThis one was really nice. In that it could also generate a white paper to go with the diagram
-
22,343163Released 2y agoFree + from $12/mo
-
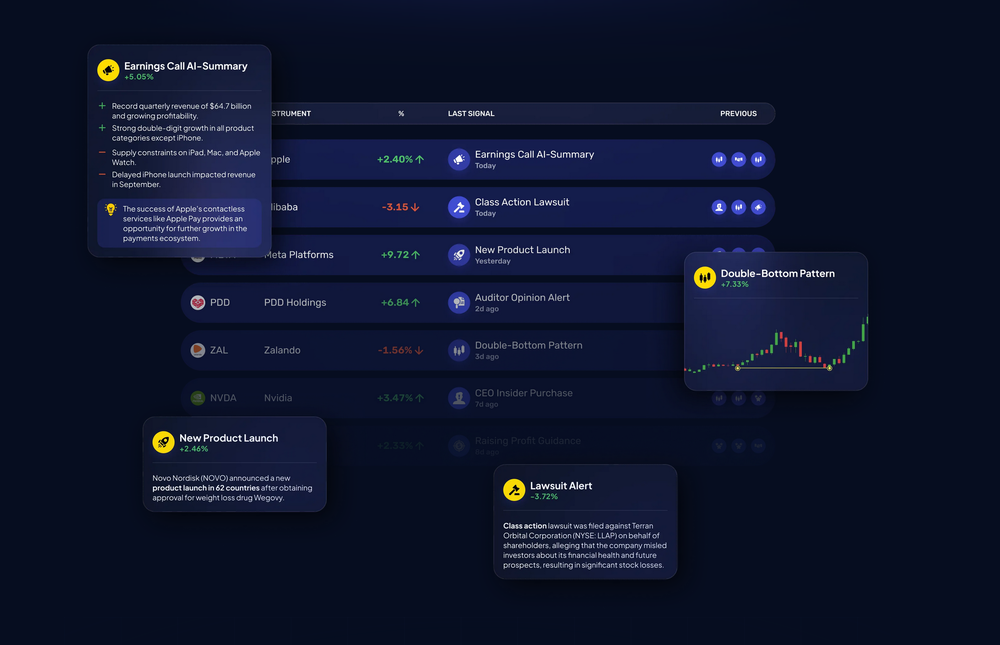
 Empower your investment strategies with AI signals, option flow data, and advanced chart patterns.Open15,573216Released 2y agoFree + from $49/moOver-priced for what it promises to do. Other AI powered services, at more affordable prices, or cheaper, some with incredible track records and scientists with great track records.
 -
14,169182Released 2y agoFrom $27.30/mo
- Sponsor:Rocket - Vibe Coding
-
21,42686Released 2y agoNo pricingI really value the sentiment analysis tool—it simplifies understanding customer feedback by picking up on their emotions. Plus, the way it groups comments into topics is super helpful for decision-making.
-
10,605161Released 5y agoFrom $69/moterrible app had to get a refund the data is wrong and doesnt match up when you check with the brokers
-
 AI-powered financial analyst from Investing.com delivering market insights and researchOpen7,07478Released 10mo agoFree + from $8.49/mo
 -
5,97755Released 2y agoFree + from $168/yr
-
5,88955Released 3y agoFrom $29/mo
-
 Financial Newsletter and SEC filing analysis, Generative AI for Investment ideasOpen5,04379Released 1y agoFree + from $25/mo
 -
27,97064Released 1y agoFree + from $5
-
3,05452Released 2y agoFree + from $12.99/moRequires an account and doesn't even include single sign in. I'm negatively bias towards any app that doesn't include single sign in. Any modern app should have single sign in.
- Didn't find the AI you were looking for?
-
3,03348Released 8mo agoFree + from $4.99/mo
-
2,45241Released 2y agoFrom $19/mo
-
1,80328Released 1y agoFrom $9/mo
-
21,69924Released 3mo agoFree + from $20/moI was just trying to get a quick graph showing population evolution over the last 30 years, didn’t have the dataset ready, so I was hoping the tool could auto-fill something reasonable. But it literally gave me three values. Three?? For 30 years?? What kind of trend can I possibly see with that? If the tool offers to research the data, it should at least offer a full timeline. And when I pasted the data I found, it created a literally bar chart???
-
1,28921Released 1y agoFree + from $19.46/moChecked it out. On first glance, it appears to be just like any other stock analysis tool. After fiddling with it for several minutes, there seems to be nothing indicating that it uses AI.
-
14,35210Released 1mo agoFree + from $8/mo
-
5308Released 2y agoFrom $9.9/mo
-
12,39473153Released 2y ago100% FreeDumber than a box of hair. Asked for a break even analysis chart. Fed it clear fixed costs, variable costs, net operating income AND ROI percentages. Even hinted that the break even point was between years six and seven. Dude took five minutes to draw a line across the "0" plane labeled "costs" and a revenue line crossing through where I suggested the break even point is. The scale was between 0.2-1.6 USD. No, I am not running a business for ants.
-
8,92138Released 2y ago100% Free


Post


