

▼ Popular
Text to chart
Free mode
100% free
Freemium
Free Trial
Featured matches
-
14,561158Released 1y agoFree + from $5
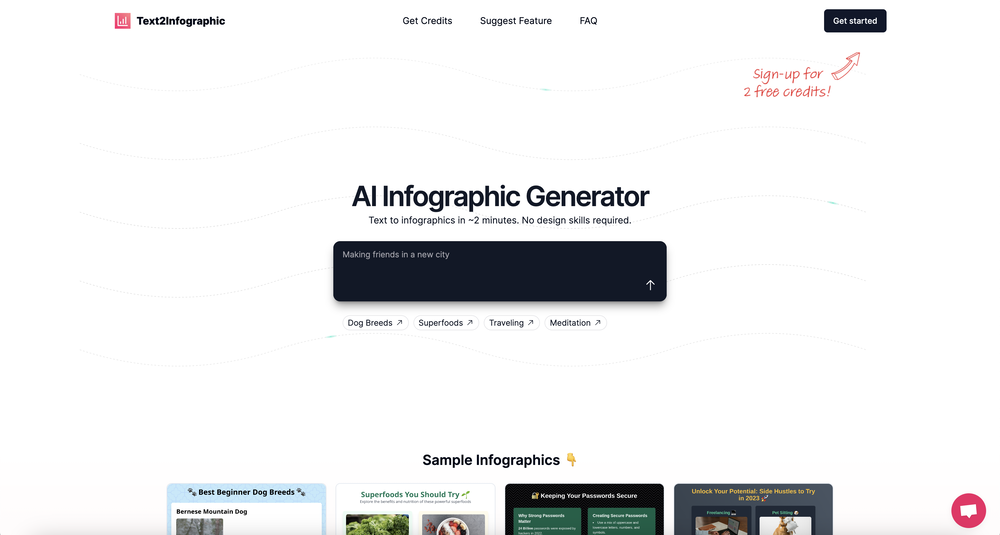 David Parsons🙏 5 karmaJun 15, 2024@Text to InfographicThis definitely has potential. The lack of control over what gets generated is annoying, in particular how it will insert meaningless graphs despite being provided with no data - there needs to be a way of preventing this. However, the fact that you can download the HTML and then edit yourself is a big plus. Unfortunately only having two credits to test it out didn't really give me a chance to find out what it could do.
 -
11,95316Released 1mo agoFree + from $7/mo


Other tools
-
26,718205v1.3 released 7mo agoFree + from $5/moThis one was really nice. In that it could also generate a white paper to go with the diagram
-
57,790267Released 2y agoFree + from $6.7/moYou spent half of hour on describing how your presentation should look like, and just after that getting informed that you need to pay subscription to proceed. Who’ll pay my time back?
-
22,389163Released 2y agoFree + from $12/mo
-
15,817101Released 2y ago100% Free
- Spotlight: Speechmatics | AI Voice Agents (Voice agents)
-
21,71886Released 2y agoNo pricingI really value the sentiment analysis tool—it simplifies understanding customer feedback by picking up on their emotions. Plus, the way it groups comments into topics is super helpful for decision-making.
-
13,55771Released 3y agoNo pricingIt does exactly what is expected and more. I asked it to create a map with pins for 30 addresses and it did exactly that within a few seconds. It has great customization options also.
-
21,210133Released 2y ago100% Free
-
9,79520Released 2y ago100% Free
-
8,88999Released 2y agoFree + from $3/mo
-
8,20443Released 2y agoFrom $6/mo
-
6,02555Released 2y agoFree + from $168/yr
-
5,60533Released 2y ago100% Free
- Didn't find the AI you were looking for?
-
4,97735Released 2y ago100% Free
-
4,18227Released 2y agoFree + from $19/mo
-
2,93222Released 1y ago100% Free
-
4,02822Released 5mo agoFree + from $5.99/mo
-
 Open1,70917Released 2y agoFree + from $2.99
 -
21,94224Released 3mo agoFree + from $20/moI was just trying to get a quick graph showing population evolution over the last 30 years, didn’t have the dataset ready, so I was hoping the tool could auto-fill something reasonable. But it literally gave me three values. Three?? For 30 years?? What kind of trend can I possibly see with that? If the tool offers to research the data, it should at least offer a full timeline. And when I pasted the data I found, it created a literally bar chart???
-
33519Released 2d ago100% Free
-
12,40373153Released 2y ago100% FreeDumber than a box of hair. Asked for a break even analysis chart. Fed it clear fixed costs, variable costs, net operating income AND ROI percentages. Even hinted that the break even point was between years six and seven. Dude took five minutes to draw a line across the "0" plane labeled "costs" and a revenue line crossing through where I suggested the break even point is. The scale was between 0.2-1.6 USD. No, I am not running a business for ants.


Post


