
Supadash
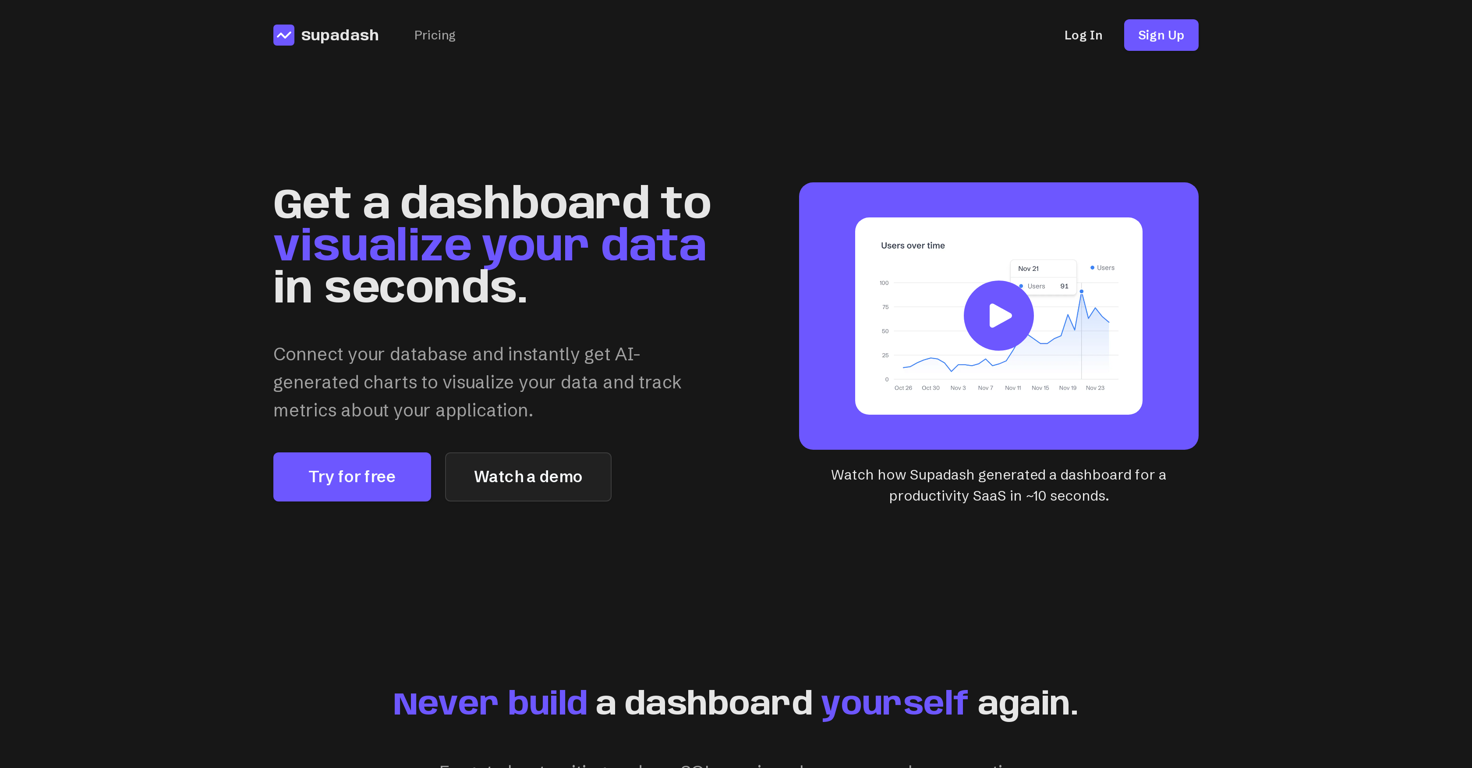
Supadash is a tool designed to simplify the process of data visualization by automatically creating data dashboards. It enables users to connect their database and instantly generates charts to help visualize and understand their data more effectively.
With this tool, lift from writing manual code and SQL queries to design and build dashboards is eliminated, as the AI-driven system within Supadash constructs the dashboard in a matter of seconds.
Various sources can be used to feed data into Supadash, including PostgreSQL databases or REST APIs, with more data source compatibility options planned for future updates.
Once the data source is connected, the tool is capable of processing and translating this information into insightful charts and visualizations. This functionality permits users to not just spot important metrics, but also derive crucial business insights from their data in a seamless and efficient manner.
Releases
Pricing
Prompts & Results
Add your own prompts and outputs to help others understand how to use this AI.
-
834,786635v1.6 released 14d agoFree + from $12/mo
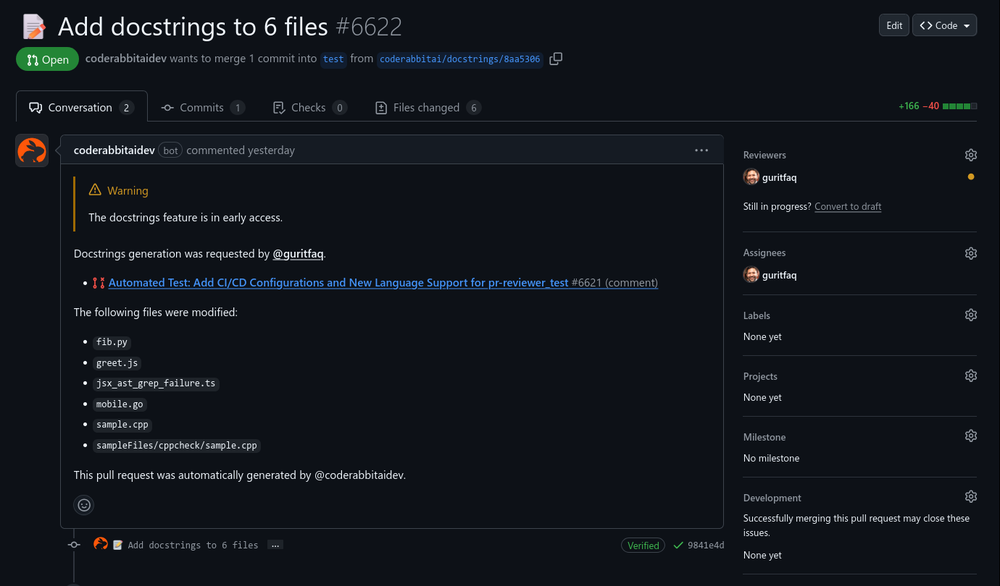 Reducing manual efforts in first-pass during code-review process helps speed up the "final check" before merging PRs
 -
28,785395v1.0 released 11mo agoFree + from $35/mo
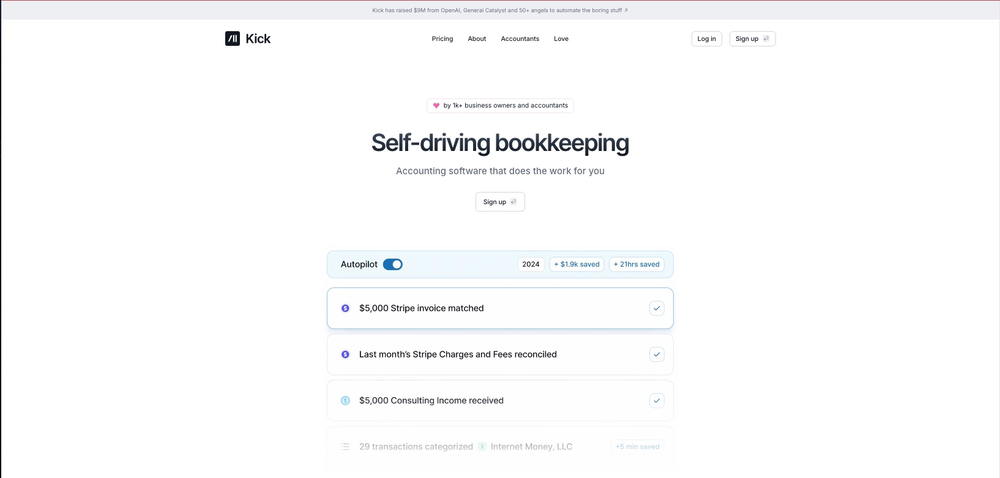 This team took the time to understand the industry, problem and its users and designed a perfectly engineered solution. Kudos.


Pros and Cons
Pros
View 17 more pros
Cons
View 4 more cons
7 alternatives to Supadash for Data visualization
-
 Chat with your data to get beautiful visualization.33,145175v2.0 released 6mo agoFree + from $75/yr
 -
 Smart insights for business, stunning visuals for creators.25,88592Released 3mo ago100% FreeI felt there is need of more ready made templates. But, it does what it claims. I chose one question suggested by the AI agent, and it created the infographics in few seconds. It's cool. Saving it for future reference.
 -
 Turn Data into Stunning Charts in Seconds20,54123Released 2mo agoFree + from $20/moI was just trying to get a quick graph showing population evolution over the last 30 years, didn’t have the dataset ready, so I was hoping the tool could auto-fill something reasonable. But it literally gave me three values. Three?? For 30 years?? What kind of trend can I possibly see with that? If the tool offers to research the data, it should at least offer a full timeline. And when I pasted the data I found, it created a literally bar chart???
 -
 Generate visualizations from data using AI4,04919Released 2y ago100% Free
 -
 Supercharge Power BI dashboards with AI-driven insights3,62536Released 2y agoFree + from $15/mo
 -
 Turn complex data into clear insights with AI.2,51551Released 1y agoFree + from $10/mo
 -
 Visualize data effortlessly with AI-powered insights.2,07526Released 1y agoNo pricing


Q&A
If you liked Supadash
Featured matches
-
9,503106Released 8d agoNo pricing
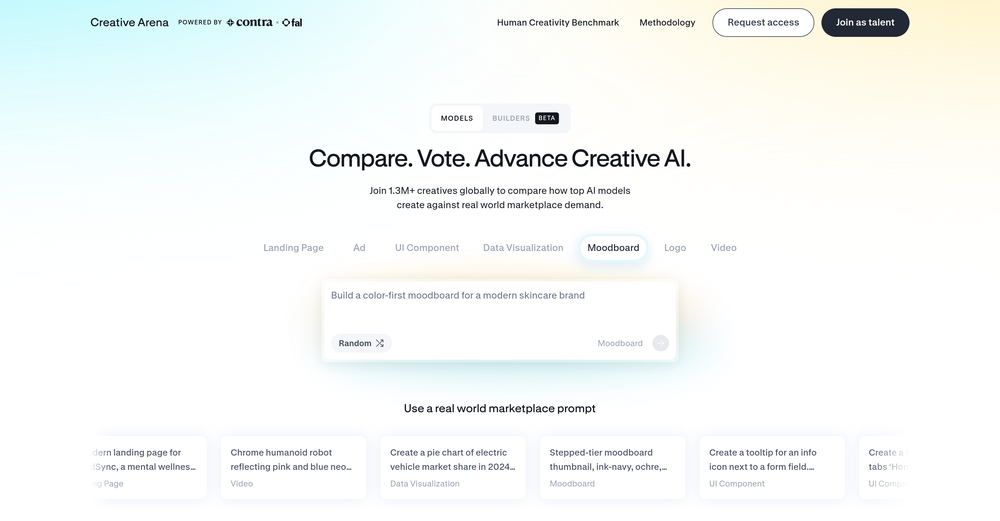 The leading generative media models on fal combined with top-earning real-world creative talent on Contra is a powerful combination. Feedback to fuel the future of creative ai.
 -
16,18439v2.2 released 21d agoFree + from $11.48/mo

-
1,57819Released 1mo agoNo pricing

-
42,91187Released 2mo agoFree + from $8/mo
 This is truly a wonderful experience that brings joy and delight.


Verified tools
-
20,00486Released 2y agoNo pricingI really value the sentiment analysis tool—it simplifies understanding customer feedback by picking up on their emotions. Plus, the way it groups comments into topics is super helpful for decision-making.


How would you rate Supadash?
Help other people by letting them know if this AI was useful.