

▼ Top rated
Ai to change text data into graphs
Free mode
100% free
Freemium
Free Trial
Featured matches
-
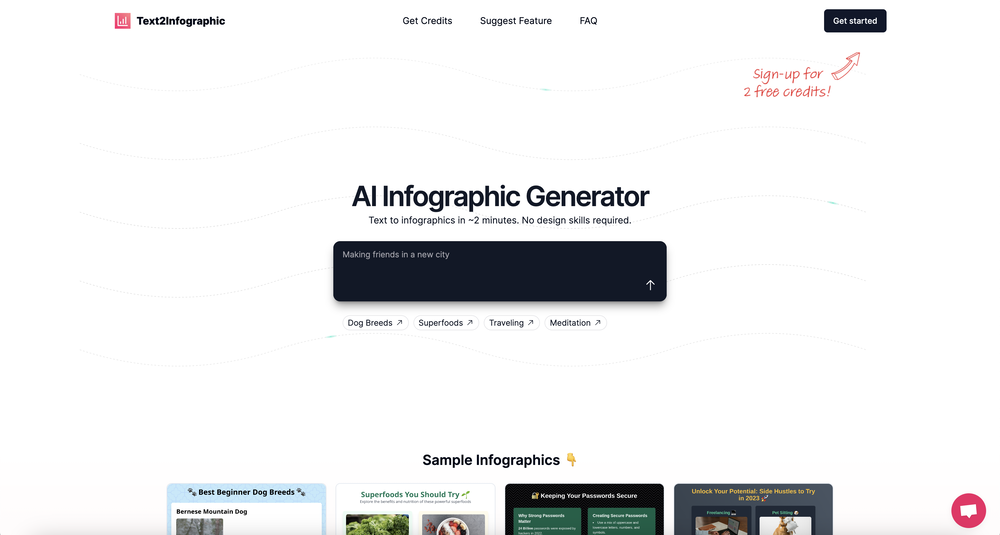
14,038154Released 1y agoFree + from $5
 David Parsons🙏 5 karmaJun 15, 2024This definitely has potential. The lack of control over what gets generated is annoying, in particular how it will insert meaningless graphs despite being provided with no data - there needs to be a way of preventing this. However, the fact that you can download the HTML and then edit yourself is a big plus. Unfortunately only having two credits to test it out didn't really give me a chance to find out what it could do.

Other tools
-
1,48715Released 2y agoFree + from $49/mo
-
4,01453Released 1y agoFree + from $3219/yrDisplayr has become an essential tool for survey data analysis. By leveraging advanced AI integration, the platform offers a user-friendly, low-code solution for analyzing survey data. Users can efficiently create presentations while working on data analysis within the same interface, eliminating the hassle of transferring numbers from Excel to PowerPoint.
-
43318Released 1y agoFree + from $4.9/mo
-
61112Released 1y agoFrom $39
- Spotlight: Questie AI (Virtual companions)
-
5,93355Released 2y agoFree + from $168/yr
-
6,50678Released 6mo agoFree + from $5/mo
-
9,88069Released 6mo agoFree + from $10/moI had to tweak a few things to match my brand style, but overall it saved me a ton of time. Definitely handy if you need something fast and professional-looking.
-
20,45486Released 2y agoNo pricingI really value the sentiment analysis tool—it simplifies understanding customer feedback by picking up on their emotions. Plus, the way it groups comments into topics is super helpful for decision-making.
-
 Create stunning hand-drawn flowcharts from text instantly.Open3,30948Released 8mo agoNo pricingI use AI Flowchart Generator to create flowcharts for my blog posts. It’s incredibly easy to use and saves me so much time. Now, I can turn my text to flowchart and make my posts more interesting and helpful for readers!
 -
8,254115Released 1y agoFree + from $9.9/mo
-
22,182162Released 2y agoFree + from $12/mo
-
33,402386Released 2y agoFree + from $5/moIt took me less than 20 minutes to create infographic perfection- all the other AI design sites I tried, and I tried them all, weren't able to give me what I wanted in 1 way or another. Outline Ninja helped me create my infographic
- Didn't find the AI you were looking for?
-
44,973230Released 1y agoFrom $150
-
2,91948Released 3y ago100% Free
-
26,415205v1.3 released 6mo agoFree + from $5/moThis one was really nice. In that it could also generate a white paper to go with the diagram
-
17,301352Released 2y ago100% Free
-
20,97423Released 2mo agoFree + from $20/moI was just trying to get a quick graph showing population evolution over the last 30 years, didn’t have the dataset ready, so I was hoping the tool could auto-fill something reasonable. But it literally gave me three values. Three?? For 30 years?? What kind of trend can I possibly see with that? If the tool offers to research the data, it should at least offer a full timeline. And when I pasted the data I found, it created a literally bar chart???
-
1,86626Released 2y agoFree + from $15/moGreat tool for getting some initial information about your data, especially in the beginning phase when your main goal is to explore your data
-
1,77328Released 1y agoFrom $9/mo
-
8403Released 2y agoNo pricing
-
1,88036Released 1y ago100% Free
-
12,34773153Released 1y ago100% FreeDumber than a box of hair. Asked for a break even analysis chart. Fed it clear fixed costs, variable costs, net operating income AND ROI percentages. Even hinted that the break even point was between years six and seven. Dude took five minutes to draw a line across the "0" plane labeled "costs" and a revenue line crossing through where I suggested the break even point is. The scale was between 0.2-1.6 USD. No, I am not running a business for ants.


Post


