

▼ Latest
Analyse charts or tables
Free mode
100% free
Freemium
Free Trial
Featured matches
-
 AI-powered Excel analysis and visualization in natural languageOpen31,55540Released 2d agoFree + from $9.9/mo
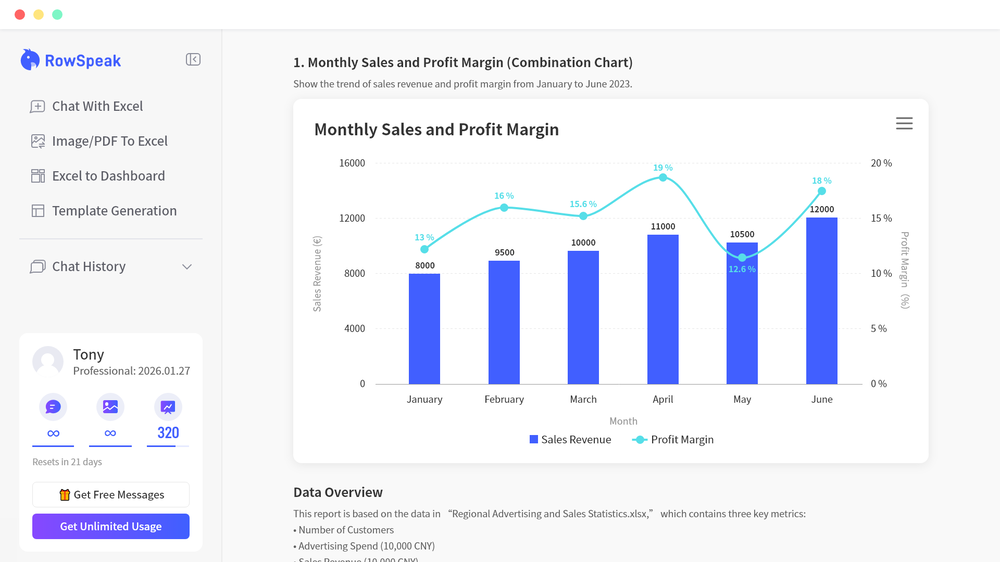 New Features & Improvements 1. New Dashboard Experience Added a powerful Dashboard feature. Users can now upload Excel or CSV files and get a clean, professional-looking data dashboard in just a few seconds. Automatically generates charts, key metrics, and summaries to help you understand your data at a glance. 2. Image/PDF to Table Conversion Added support for image-to-table conversion: turn table images into editable Excel data. Added support for PDF-to-table conversion: extract tabular data from PDFs into structured spreadsheets. Greatly reduces manual copy‑and‑paste work from screenshots and documents. 3. Faster, Smarter Data Processing Optimized the backend engine for faster response times. Improved data interpretation for more accurate and intelligent handling of complex tables and edge cases. Better performance for large files and multi-step transformations. 4. Enhanced Excel Editing & Data Cleaning Now supports editing Excel file styles, including formatting, cell styles, and layout adjustments. Added data cleaning tools to quickly remove duplicates, standardize formats, fix common errors, and tidy messy datasets. Makes it easier to go from raw data to polished, ready-to-use spreadsheets.
 -
3526Released 28d agoNo pricing


Verified tools
-
14,601131Released 2y agoFree + from $16.77/mo
 Alexandru Bostina🛠️ 2 tools 🙏 7,053 karmaMay 5, 2025@JuliusIt works for me, might’ve been a temporary issue. Give it another try!
 -
21,93186Released 2y agoNo pricingI really value the sentiment analysis tool—it simplifies understanding customer feedback by picking up on their emotions. Plus, the way it groups comments into topics is super helpful for decision-making.
-
46,961231Released 1y agoFrom $150
-
 AI spreadsheet & data analyst. 10x your productivity.Open26,058108Released 1mo agoFree + from $20/moI use our tool for cleaning data, research and writing scripts before a mail merge. Saves me hours.
 - Spotlight: LiGo (for LinkedIn) (Linkedin engagement)
-
30,69699Released 5mo agoFree + from $180I felt there is need of more ready made templates. But, it does what it claims. I chose one question suggested by the AI agent, and it created the infographics in few seconds. It's cool. Saving it for future reference.
-
4,04243Released 2y agoFree + from $7/moSurprisingly powerful data transformation tool for data scientists and data analysts. Quick onboarding and easy visual interface. I used AI for sentiment analysis and categorization of game reviews for dataset over 20,000 rows, works pretty fine.


Other tools
-
3,14949Released 9mo agoFree + from $4.99/mo
-
1,81628Released 1y agoFrom $9/mo
-
22,414163Released 2y agoFree + from $12/mo
-
1,82520Released 1y agoFrom $35/mo
-
26,860205Released 7mo agoFree + from $5/moThis one was really nice. In that it could also generate a white paper to go with the diagram
-
22,10524Released 4mo agoFree + from $20/moI was just trying to get a quick graph showing population evolution over the last 30 years, didn’t have the dataset ready, so I was hoping the tool could auto-fill something reasonable. But it literally gave me three values. Three?? For 30 years?? What kind of trend can I possibly see with that? If the tool offers to research the data, it should at least offer a full timeline. And when I pasted the data I found, it created a literally bar chart???
-
1,94926Released 2y agoFree + from $15/moGreat tool for getting some initial information about your data, especially in the beginning phase when your main goal is to explore your data
-
2,20414Released 2y ago100% Free
-
4649Released 1y agoFree + from $9.99/mo
-
2,78638Released 1y ago100% Free
-
2,1014Released 2y agoFree + from $19/mo
-
9017Released 1y agoNo pricing
- Didn't find the AI you were looking for?
-
3,41515Released 2y agoFree + from $19/mo
-
12,41273153Released 2y ago100% FreeDumber than a box of hair. Asked for a break even analysis chart. Fed it clear fixed costs, variable costs, net operating income AND ROI percentages. Even hinted that the break even point was between years six and seven. Dude took five minutes to draw a line across the "0" plane labeled "costs" and a revenue line crossing through where I suggested the break even point is. The scale was between 0.2-1.6 USD. No, I am not running a business for ants.
-
8,93438Released 2y ago100% Free


Post


