
TAAFT Tutorial
Generate image
Tasks
Generate text
Free mode
Trending
Leaderboard
Characters
 Mini tools
New
Featured
Lists
Agents
Requests
Jobs
Map
Newsletter
Starter pack
Free tools
Speech to text
Text translator
Remove background
Settings
Edit profile
My tools
Gallery
Dashboard
Inbox
Get featured
Contact TAAFT
For you
Popular
Job impact index
Most saved
Affiliate program
Submit AI tool
Notification preferences
Glossary
Home
Timeline
My profile
Create tool
Deals
Companies
Models
Robots
Papers
Fundraises
Repositories
Devices
Organizations
Events
Prompt Pack
Merchendise
APIs
Features
Tools
Countries
Collections
Videos
Mini tools
New
Featured
Lists
Agents
Requests
Jobs
Map
Newsletter
Starter pack
Free tools
Speech to text
Text translator
Remove background
Settings
Edit profile
My tools
Gallery
Dashboard
Inbox
Get featured
Contact TAAFT
For you
Popular
Job impact index
Most saved
Affiliate program
Submit AI tool
Notification preferences
Glossary
Home
Timeline
My profile
Create tool
Deals
Companies
Models
Robots
Papers
Fundraises
Repositories
Devices
Organizations
Events
Prompt Pack
Merchendise
APIs
Features
Tools
Countries
Collections
Videos

▼ Popular
Graph to text
Free mode
100% free
Freemium
Free Trial
Featured matches
-
 Make Better Decisions with Data-Driven Charts, Clear Explanations, and Insightful AnalysisOpen
-
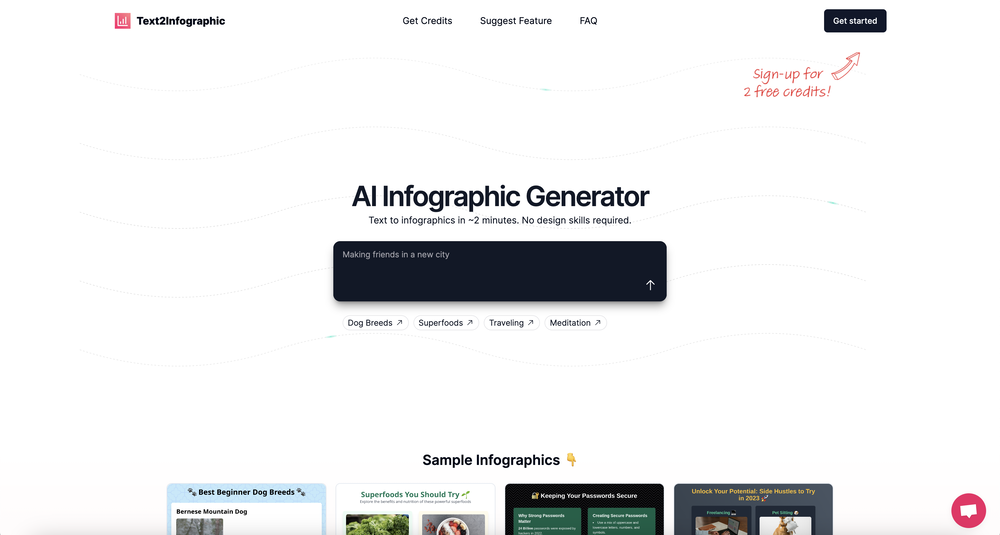
 Michelle Ashton🙏 3 karmaJul 8, 2024@Text to InfographicWhich is more valuable, time or money? This doesn't save you either, at the moment as you only get two infographics to test out and you have to do quite a bit of editing to get it to look ok. The point of infographics is to inform in a highly visual and compelling way. None of the example info graphics are that. I suggest a pivot and use AI to fill out the text in a pre-made graphic template.
Other tools
-
thank you very much for this. i'll add some points: 1. its too fast, i cant make out where and when the pen leaves the paper and when it continues 2. there should be a pause and rewind mechanism, like a video player 3. a pen to paper angle indicator would be nice
-
-
This one was really nice. In that it could also generate a white paper to go with the diagram
-
- Sponsor
 Tripo AI 3D Generator
 -
I wasn't able to use this one (I have my API key)
-
-
-
- Didn't find the AI you were looking for?
-
 Create stunning hand-drawn flowcharts from text instantly.OpenI use AI Flowchart Generator to create flowcharts for my blog posts. It’s incredibly easy to use and saves me so much time. Now, I can turn my text to flowchart and make my posts more interesting and helpful for readers!
 -
Great tool for getting some initial information about your data, especially in the beginning phase when your main goal is to explore your data
-
-
Dumber than a box of hair. Asked for a break even analysis chart. Fed it clear fixed costs, variable costs, net operating income AND ROI percentages. Even hinted that the break even point was between years six and seven. Dude took five minutes to draw a line across the "0" plane labeled "costs" and a revenue line crossing through where I suggested the break even point is. The scale was between 0.2-1.6 USD. No, I am not running a business for ants.
-
 Open
Open


