

▼ Popular
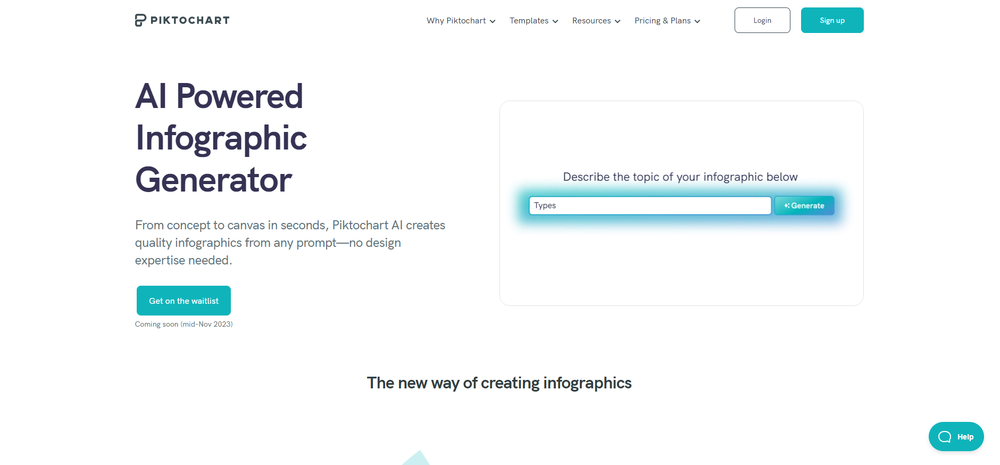
Piktochart
Free mode
100% free
Freemium
Free Trial
Featured matches
-
 AI-powered imagery for children's books.Open
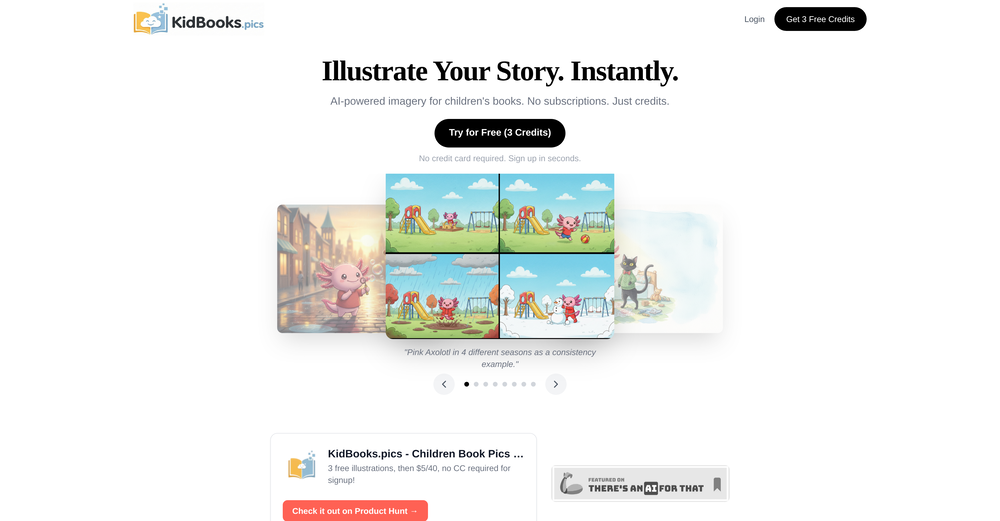
 Super songoku41🙏 3 karmaFeb 23, 2026@KidBooks.pics - Kids Book Image Generatortested this for a side project and the art style is more picture book than manga but still useful for reference. generated like 50 character expressions in different angles. saves time when planning panel layouts
 -
 Make Better Decisions with Data-Driven Charts, Clear Explanations, and Insightful AnalysisOpen
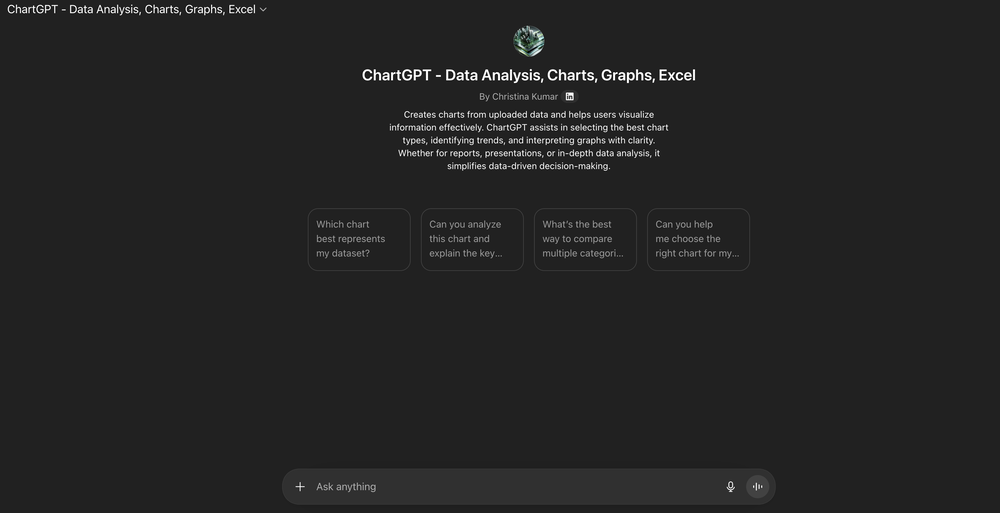 Efficient for charts, graphs, and data analysis.
 -
 The infographic maker lets you use it once for free without signing in. This infographic maker is simple and easy to use, even more so than Canva or Venngage. However, the available styles and templates are still limited. I hope they add more design options and customization in future updates. Overall, a good choice for quickly creating infographics.


Other tools
-
This one was really nice. In that it could also generate a white paper to go with the diagram
-
-
-
I like the design and UI of the quizzes. It works similar to other AI quiz tools. Some questions and answers will have to be edited, at this point that is to be expected.
- Sponsor
 Rocket - Think it. Type it. Launch it.
 -
-
-
I felt there is need of more ready made templates. But, it does what it claims. I chose one question suggested by the AI agent, and it created the infographics in few seconds. It's cool. Saving it for future reference.
-
 Open
Open - Didn't find the AI you were looking for?
-
Great tool for getting some initial information about your data, especially in the beginning phase when your main goal is to explore your data
-
I was just trying to get a quick graph showing population evolution over the last 30 years, didn’t have the dataset ready, so I was hoping the tool could auto-fill something reasonable. But it literally gave me three values. Three?? For 30 years?? What kind of trend can I possibly see with that? If the tool offers to research the data, it should at least offer a full timeline. And when I pasted the data I found, it created a literally bar chart???
-
-
Says "free during testing," but keeps telling me I have insufficient credits. I also can't seem to find a way to delete my account.
-
Dumber than a box of hair. Asked for a break even analysis chart. Fed it clear fixed costs, variable costs, net operating income AND ROI percentages. Even hinted that the break even point was between years six and seven. Dude took five minutes to draw a line across the "0" plane labeled "costs" and a revenue line crossing through where I suggested the break even point is. The scale was between 0.2-1.6 USD. No, I am not running a business for ants.


Post


