

▼ Most saved
Summarize charts
Free mode
100% free
Freemium
Free Trial
Featured matches
-
 Instantly summarize and chat with any webpage.Open1,84119Released 6mo agoNo pricing
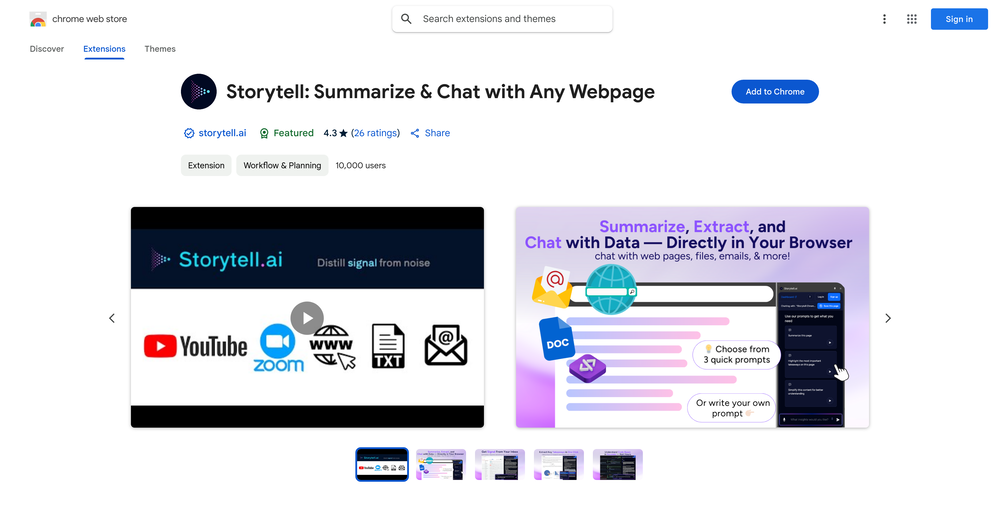
Other tools
-
47,4851,441v1 released 3y agoFree + from $9.99/mo
 Ron Jayson🙏 74 karmaMar 1, 2024easy to pick up and you get a few free file imports. it gives you results pretty fast, unfortunately i can't find a way to get back to these, they're locked behind the paid service.
 -
33,701888Released 2y ago100% FreeIt seems to be working fine right now. Maybe try again and double check if you’re using the book’s original or most recognized title. That might make a difference.
-
4,009227Released 2y agoNo pricingWould recommend! Takes ~30 seconds and saves a significant amount of time.
-
26,337205v1.3 released 5mo agoFree + from $5/moThis one was really nice. In that it could also generate a white paper to go with the diagram
- Sponsor:Rocket.new Vibe Coding
-
22,103162Released 2y agoFree + from $12/mo
-
11,00990Released 2y agoFree + from $4.99/mo
-
5,11389Released 1y agoFree + from $2.49/moI've tried several Youtube summarizers and this is...by far...the best.
-
19,98386Released 2y agoNo pricingI really value the sentiment analysis tool—it simplifies understanding customer feedback by picking up on their emotions. Plus, the way it groups comments into topics is super helpful for decision-making.
-
22,87576Released 1y agoNo pricingFree version is limited to 5 pages for PDFs. I could not find a file short enough to even test this product. I give up.
-
 Open3,20952Released 1y agoFree + from $9/mo
 -
8,58849Released 2y agoFree + from $3/mo
-
5,31748Released 2y agoFree + from $4.99/mo
- Didn't find the AI you were looking for?
-
1,80636Released 1y ago100% Free
-
16,15334Released 2y ago100% Free
-
3,31333Released 10mo agoFree + from $9.99/mo
-
1,83526Released 2y agoFree + from $15/moGreat tool for getting some initial information about your data, especially in the beginning phase when your main goal is to explore your data
-
20,51723Released 2mo agoFree + from $20/moI was just trying to get a quick graph showing population evolution over the last 30 years, didn’t have the dataset ready, so I was hoping the tool could auto-fill something reasonable. But it literally gave me three values. Three?? For 30 years?? What kind of trend can I possibly see with that? If the tool offers to research the data, it should at least offer a full timeline. And when I pasted the data I found, it created a literally bar chart???
-
4,62119Released 2y agoFree + from $9/mo
-
3,60719Released 2y agoFree + from $20/mo
-
5,57918Released 2y agoFree + from $6.67/mo
-
3,40017Released 2y ago100% Free
-
2,21711Released 2y agoFree + from $4.99/mo
-
9286Released 1y agoFree + from $0.0015
-
6514Released 4y agoFrom $6.99/mo
-
7012Released 2y agoFrom $7/mo
-
91Released 2y agoNo pricing
-
12,29873153Released 1y ago100% FreeDumber than a box of hair. Asked for a break even analysis chart. Fed it clear fixed costs, variable costs, net operating income AND ROI percentages. Even hinted that the break even point was between years six and seven. Dude took five minutes to draw a line across the "0" plane labeled "costs" and a revenue line crossing through where I suggested the break even point is. The scale was between 0.2-1.6 USD. No, I am not running a business for ants.


Post


