
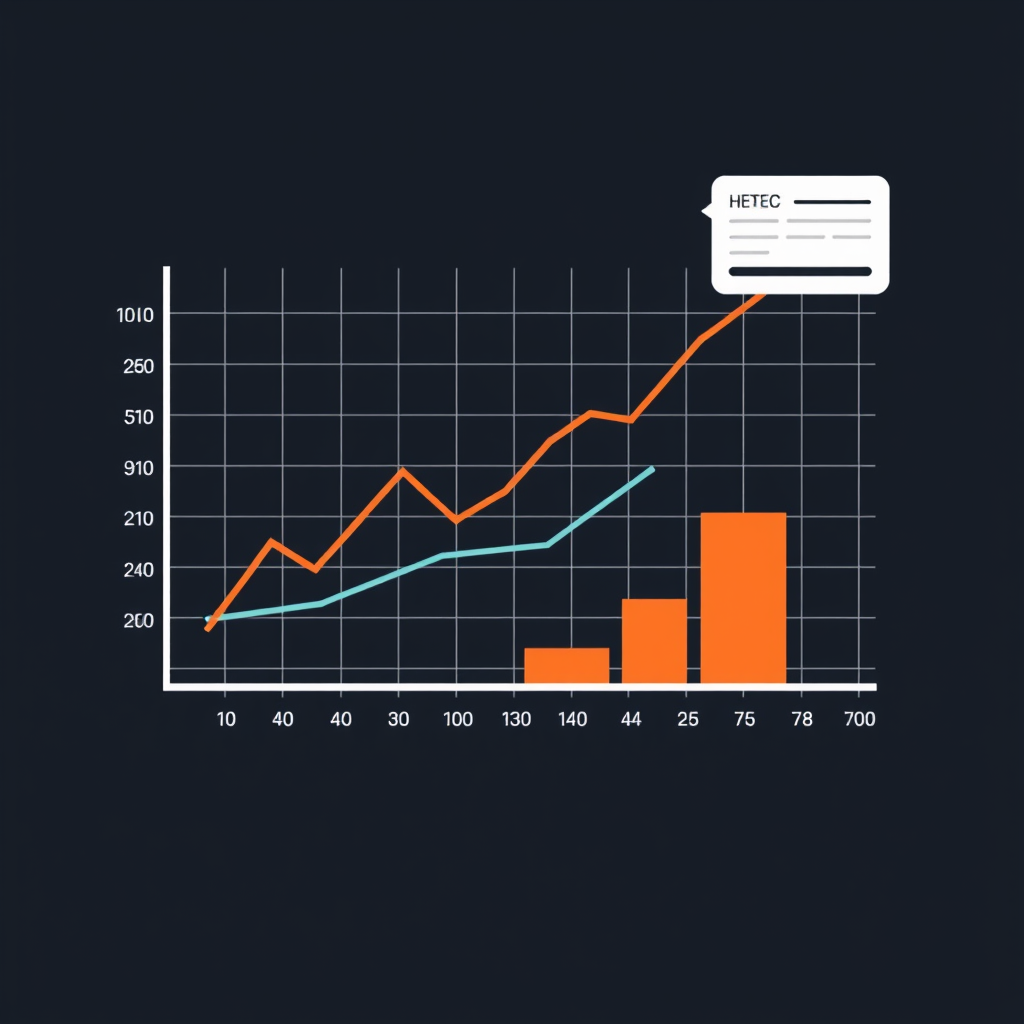
—Chat with your data to get beautiful visualization.
Go to 📊 Data visualization
 StatPecker
 VibeChart
 LIDA
LIDA
 PowerBI AI Lens
 vizGPT
 ChatViz
 ChartFast
 Supadash
 Polymer
 Tableau
 Vizzy
Vizzy
 Consistence Image Generator
 Graph Generator
 Financial Graph Generator
 Data visualizer
 Market Survey Generator
 PowerBi interactive Dashboards
 Shruti
 Data Analytics
 Me
Me
25,625
20,472
4,047
3,618
2,471
2,069
1,755
1,656
1,525
1,507
790
337
29
17
12
12
11
8
7
5
Go to 💼 Business
 BDG
BDG
 Business development
 Business Development
 ILUSTRE BOT
 Viz a biz
274
110
50
33
10
📢
Marketing
(1899)
💾
Data
(367)
💼
Sales
(340)
💰
Finance
(335)
📞
Customer support
(283)
💡
Startups
(247)
🧠
AI
(230)
👔
HR
(194)
⚖️
Legal
(151)
📊
Market research
(125)
📅
Meetings
(115)
💳
E-commerce
(100)
📊
Product management
(93)
👔
Management
(92)
📊
Project management
(72)
📊
Spreadsheets
(68)
📚
Documents
(64)
💼
Business consulting
(52)
💼
Business plans
(46)
🔒
Security
(45)
Columnsv2.0
Data visualization
32,984
4.0
Inputs:
Outputs:
Gemini 2.0 Flash Thinking Experimental
Chat with your data to get beautiful visualization.
Most popular alternative: StatPecker (88 saves)
Socials:


Columns: AI-Powered Data Visualization Made Simple
Columns is an advanced AI-driven data visualization platform that transforms how you analyze and present data. With natural language input, you can create stunning visualizations effortlessly—no coding or complex tools required.
Seamless Workflow:
1. Connect various data sources effortlessly.
2. Chat with AI to generate insightful analyses and visualizations.
3. Customize with flexible branded themes and styles.
4. Tell compelling stories with powerful storytelling tools.
5. Share and embed interactive data stories with ease.
See It in Action
🚀 Watch a 1-minute demo: https://youtu.be/4kbO5mXxOeY
📊 Explore charts: https://app.fina.money/url/mvjPmeKzw1Cark
Show more
Releases
Get notified when a new version of Columns is released
Notify me
Mar 4, 2025

Shawn Cao
🚀 Columns Update: Now Powered by Gemini 2.0 Flash!
We've integrated Gemini 2.0 Flash to deliver a smoother, faster AI chatting experience in Columns. Now, through AI chat, you can:
Preview your data samples effortlessly.
Get analysis suggestions for data visualization.
Refresh your graphs with AI-generated themes and styles.
🔥 More Exciting Improvements:
Enhanced time series analysis for deeper insights.
Easier customization across all chart types.
New data transformations to explore your data from different perspectives.
Try it out today and start chatting with Columns!
🎥 Watch the 1-minute demo: https://youtu.be/1cugv1C8Ji0
Show more
May 3, 2023
Shawn Cao
Initial release of Columns.
Pricing
Pricing model
Freemium
Paid options from
$75/year
Billing frequency
Yearly
Data visualization
32,984
4.0Prompts & Results
Add your own prompts and outputs to help others understand how to use this AI.
Columns was manually vetted by our editorial team and was first featured on May 3rd 2023.
-
822,238635v1.6 released 12d agoFree + from $12/mo
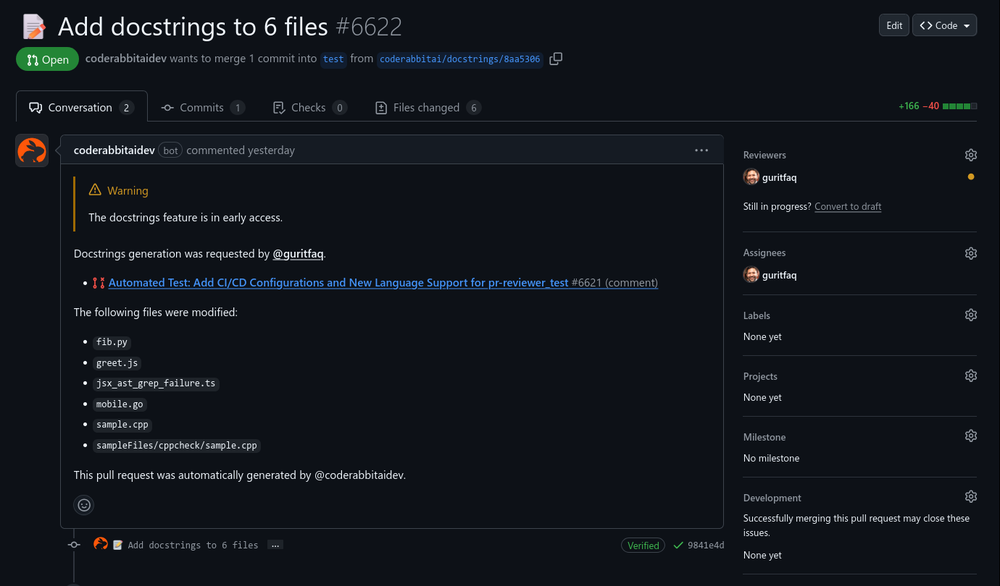 Reducing manual efforts in first-pass during code-review process helps speed up the "final check" before merging PRs
 -
28,695392v1.0 released 11mo agoFree + from $35/mo
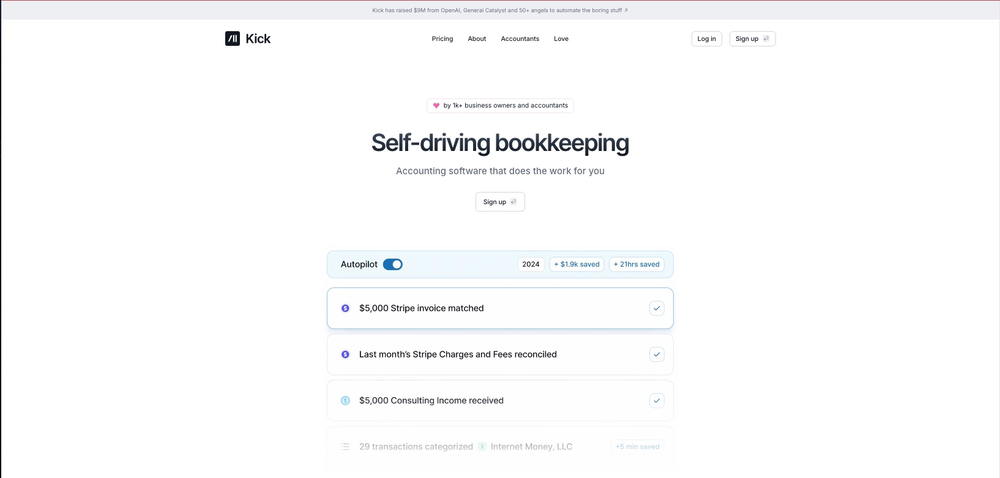 This team took the time to understand the industry, problem and its users and designed a perfectly engineered solution. Kudos.


Pros and Cons
Pros
Real-time data visualization
Collaboration in real-time
Natural language inputs
Fine-grained access controls
Self-serve data storytelling
JavaScript based
Integration capabilities
Chat with GPT-3
Instant data visualizations
Wide template range
Pre-built visualization tools
Variety of chart types
Library of design elements
Slack and Github Integrations
Facilitates data sharing
Management of data catalogs
Speech-based querying
Flexible data queries
Automated data interpretation
Inclusivity of public data
Offers popular data searches
Community tips and practices
Multiple platform visibility
Communicates data effectively
Access via website
Seamless tool integration
User-friendly interface
Newsletter for data storytellers
Flexible data storytelling
Visualizing vast data types
Data platform exploration feature
In-built data research feature
Supports multiple chart forms
Tools for data beautification
Fast data visualization platform
View 30 more pros
Cons
Requires Javascript
Limited integration options
Relies on GPT-3
No desktop app
Real-time collaboration issues
Limited icon library
Unclear data management system
Limited template variety
No mentioned multi-language support
Potentially steep learning curve
View 5 more cons
Included in lists
3 public lists


7 alternatives to Columns for Data visualization
-
 Smart insights for business, stunning visuals for creators.25,62588Released 3mo ago100% FreeI felt there is need of more ready made templates. But, it does what it claims. I chose one question suggested by the AI agent, and it created the infographics in few seconds. It's cool. Saving it for future reference.
 -
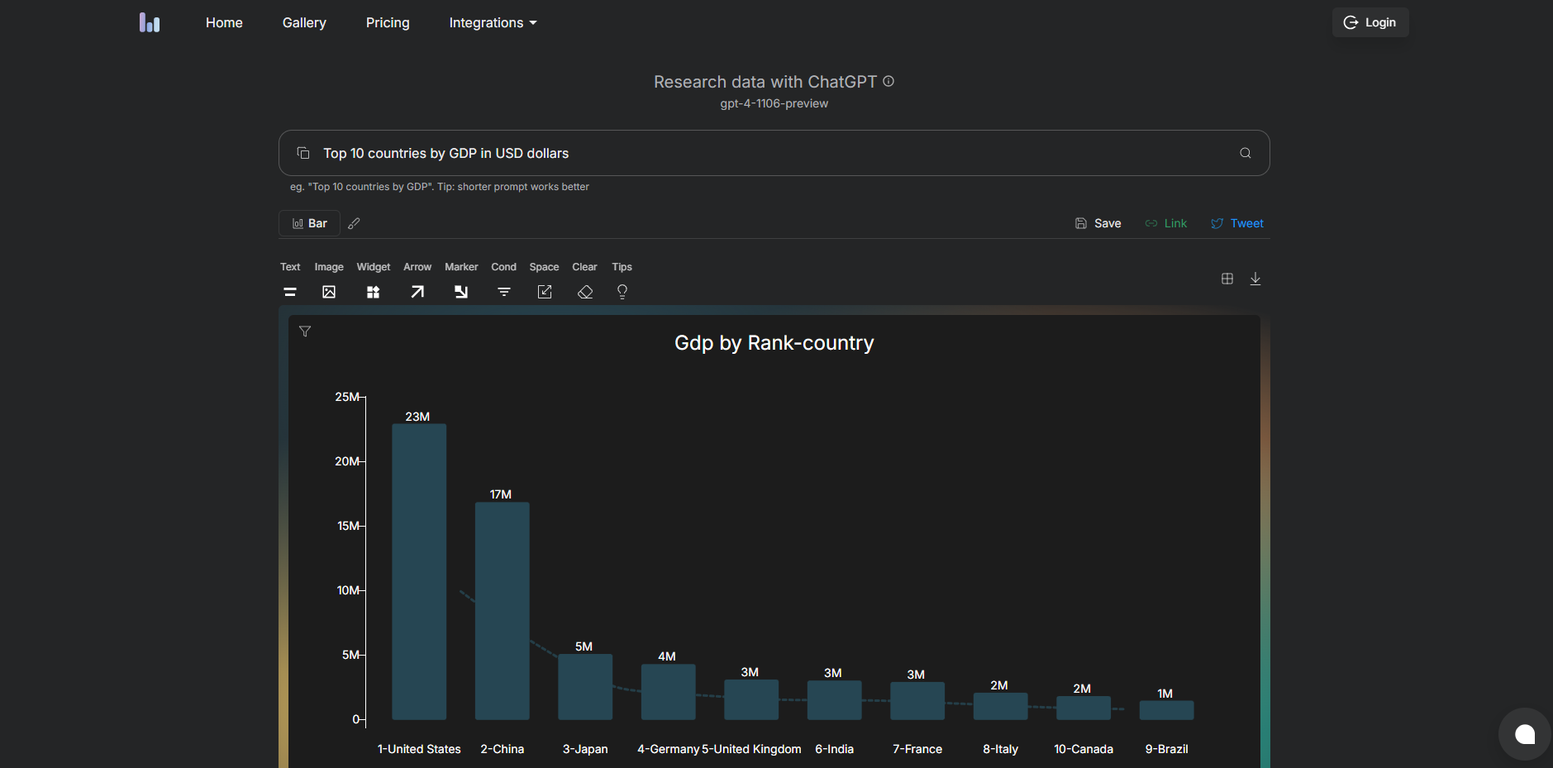
 Turn Data into Stunning Charts in Seconds20,47223Released 2mo agoFree + from $20/moI was just trying to get a quick graph showing population evolution over the last 30 years, didn’t have the dataset ready, so I was hoping the tool could auto-fill something reasonable. But it literally gave me three values. Three?? For 30 years?? What kind of trend can I possibly see with that? If the tool offers to research the data, it should at least offer a full timeline. And when I pasted the data I found, it created a literally bar chart???
 -
 Generate visualizations from data using AI4,04719Released 2y ago100% Free
 -
 Supercharge Power BI dashboards with AI-driven insights3,61836Released 2y agoFree + from $15/mo
 -
 Turn complex data into clear insights with AI.2,47151Released 1y agoFree + from $10/mo
 -
 Visualize data effortlessly with AI-powered insights.2,06923Released 1y agoNo pricing
 -
 Your AI data analyst for instant visualizations.1,75528Released 1y agoFrom $9/mo


View 20 more alternatives
Q&A
What is Columns?
Columns is a data analysis and visualization platform that helps you to create, manage, and share data insights with your audience.
It is a lightweight, AI-powered solution designed for speed, simplicity, and effortless collaboration.
Who are the ideal users of Columns?
Anyone who loves data storytelling! But it’s especially great for:
• Media professionals – Journalists, editors, and content creators.
• Business leaders – To track KPIs and make data-driven decisions.
• SMB owners – To generate professional insights and seamlessly embed them.
Why should I not just use Excel or Google Sheets instead?
Think of Columns as a powerful visual layer on top of your data. Here are some benefits:
• It makes sharing clean, professional graphs effortless while keeping them automatically updated.
• Columns processes thousands of rows in sub-seconds, whereas spreadsheets can become cumbersome and slow when handling large datasets.
• It makes a lot more beautiful and visuals than Spreadsheets.
Why not Tableau or Power BI?
The simple answer: They're overkill.
• Traditional BI tools have a steep learning curve.
• They lack AI-assisted workflows for a seamless experience.
• Sharing and embedding insights is cumbersome.
What kind of data sources can I connect?
Live connections include Google Sheets, Airtable, Notion Database, HTTP API, SQL database, and Excel/CSV files upload.
What types of charts and graphs can I create?
Columns supports a wide range of charts, including bar, line, pie, scatter, map, table, gauge, word cloud, and more.
You can also apply transformations and use chart tools to customize your visualizations in ways that are difficult to achieve elsewhere.
More: https://medium.com/data-science-collective/mastering-data-visualization-common-charts-and-their-variants-90d6502711bc
+ Show 9 more
Ask a question
If you liked Columns
Featured matches
-
8,952106Released 5d agoNo pricing
 The leading generative media models on fal combined with top-earning real-world creative talent on Contra is a powerful combination. Feedback to fuel the future of creative ai.
 -
15,91437v2.2 released 18d agoFree + from $11.48/mo

-
1,27819Released 1mo agoNo pricing

-
42,57187Released 2mo agoFree + from $8/mo
 This is truly a wonderful experience that brings joy and delight.


Verified tools
-
19,91985Released 2y agoNo pricingI really value the sentiment analysis tool—it simplifies understanding customer feedback by picking up on their emotions. Plus, the way it groups comments into topics is super helpful for decision-making.


How would you rate Columns?
Help other people by letting them know if this AI was useful.