What is Vizzy?
Vizzy is an AI-powered tool designed to rapidly visualize data. It can connect with OpenAI via an API token, allowing users to leverage a suite of AI tools. Vizzy can work with a diverse range of data and is ideal for various fields such as public health, legislative changes, geographical data, media scripts, and more. It encourages collaboration on public projects and contributes to its development on GitHub. While usage costs are low, users are responsible for any charges incurred.
What types of data can Vizzy visualize?
Vizzy can visualize any kind of data. This versatility makes it suitable for a variety of fields, ranging from public health information to geographic and legislative data, and even to media scripts like television shows.
Can I use Vizzy for public health data visualization?
Yes, you can use Vizzy for visualizing public health data. The AI is adept at handling diverse data types, including information related to public health.
How do I upload my data files to Vizzy?
To upload your data files to Vizzy, you use its provided data uploading functionality. The specifics are not outlined on their website, but typically this involves selecting the file from your local device or providing a could storage link.
How does the collaboration on public projects in Vizzy work?
Vizzy enables collaboration on public projects. While specifics are not detailed on their website, such platforms typically allow multiple users to access, edit, and collaborate on projects. You can also inspect examples in the Public Project Gallery.
Can I make my Vizzy projects private?
Yes, while all projects and data used with Vizzy are typically public, there are options to make your projects private if required.
How can I contribute to Vizzy on GitHub?
You can contribute to Vizzy on GitHub. By following the link and setting up an account on GitHub (if you don't already have one), you can suggest improvements, changes, or add to the codebase.
What are the cost implications of using Vizzy?
While Vizzy is generally a low-cost tool, users are solely responsible for any charges incurred during usage. Typical usage costs less than $1 per project, but the final cost depends on user behavior and is subject to bugs.
How do I set spending limits on my OpenAI account while using Vizzy?
To set spending limits on your OpenAI account while using Vizzy, follow the provided link on their website to your OpenAI account settings where you can manage your spending limits.
What kind of API token is required for Vizzy?
The API token required for Vizzy is meant for OpenAI. You can get this token from the OpenAI platform.
Does Vizzy store my OpenAI API token?
No, Vizzy does not store your OpenAI API token. The key is only saved in your browser and will not be stored on Vizzy’s servers.
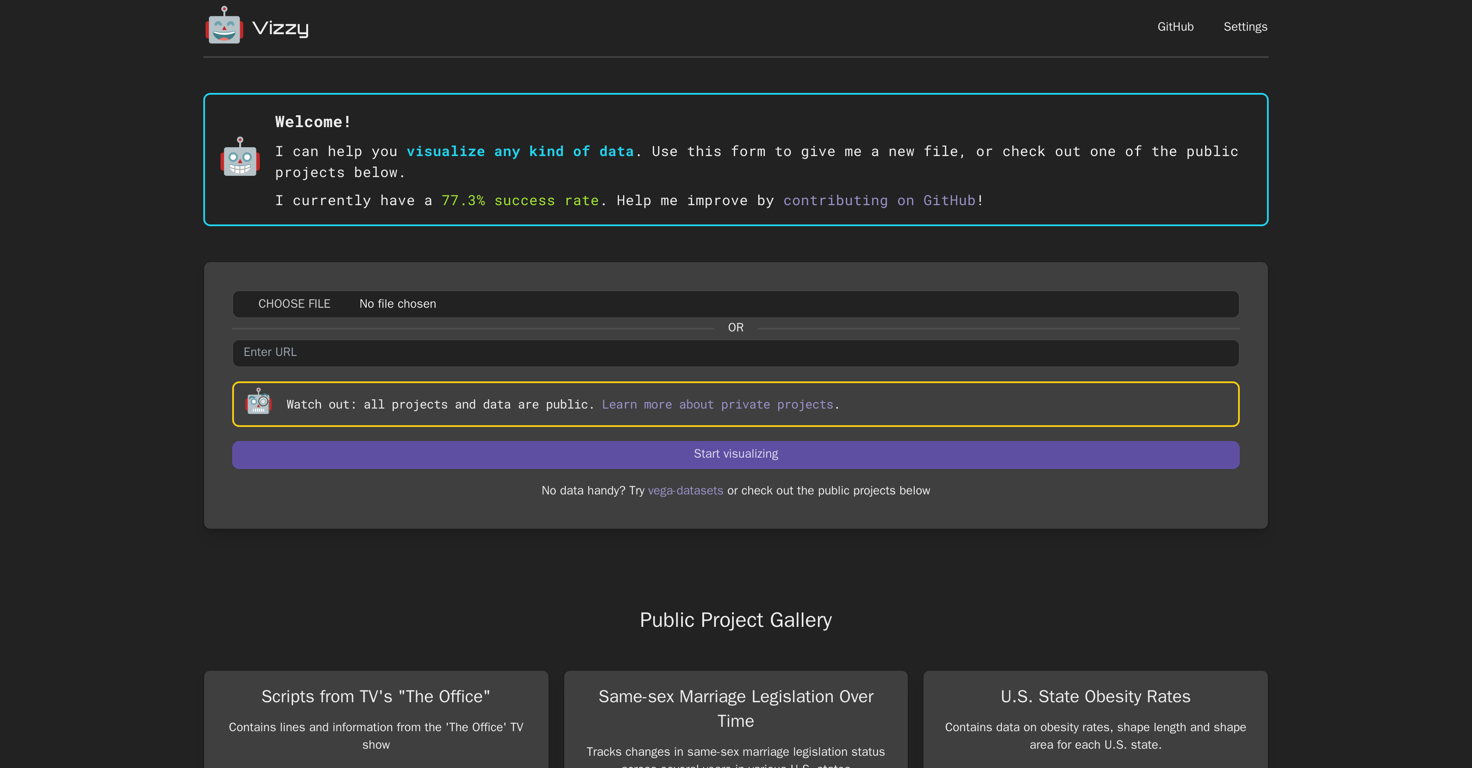
What is the success rate of Vizzy in visualizing data?
The stated success rate of Vizzy in visualizing data is 77.3%. Help boost this rate by contributing on GitHub.
Where can I view sample projects visualized by Vizzy?
You can view sample projects visualized by Vizzy in the Public Project Gallery on their website. Examples include scripts from TV shows, changes in legislation over time, obesity rates in different states, and more.
Can Vizzy analyze scripts from TV shows?
Yes, Vizzy can analyze scripts from TV shows. An example of this was given on their website in the Public Project Gallery where datasets from 'The Office' TV show were visualized.
Can Vizzy track changes in legislation over time?
Yes, Vizzy can track changes in legislation over time. As an example, it has been used to track changes in same-sex marriage legislation across various U.S. states.
How does Vizzy help with understanding obesity rates among different states?
Vizzy assists in understanding obesity rates among different states by visualizing the data. Depending on the data you feed it, Vizzy can help to depict patterns, trends, and correlations in obesity rates across various states.
Is there a support or community forum for Vizzy users?
Their website suggests that for any questions or feedback, users can open an issue on GitHub. However, there is no explicit mention of a dedicated community forum for Vizzy users.
Are there any limitations or considerations when using Vizzy?
All projects and data used with Vizzy are public, so those with sensitive data may want to consider other options or utilize the private project options. Additionally, all charges incurred during usage are the sole responsibility of the users, so they are advised to set spending limits on their OpenAI accounts. Lastly, any issue or question can be raised on the GitHub page.