
Data Model Diagrams
Data Model Diagrams is a GPT that functions as an interface for creating HTML visual data models using mermaid.js. This tool leverages the natural language processing capabilities of the ChatGPT platform to interpret user inputs and generate corresponding data models.
This dynamic tool works by individuals describing their data model or concept, which it then transforms into an HTML visualization. Examples of usage suggestions include designing a class diagram for an eCommerce store, structuring a flowchart for a booking process, formulating a sequence diagram for an authentication flow, or producing a Gantt chart for a project timeline.
With this AI-powered tool, users can easily visualize complex data models and workflows by simply describing them in natural language. It is designed to streamline tasks in fields like software engineering and project management, among others.
The GPT, however, requires a ChatGPT Plus subscription, indicating that some form of membership might be necessary to utilize it. Created by Matthew Lamb, 'Data Model Diagrams' offers an innovative, simplified approach to data model designing in everyday workflow planning and execution.
Releases
Pricing
Prompts & Results
Add your own prompts and outputs to help others understand how to use this AI.
-
821,538635v1.6 released 12d agoFree + from $12/mo
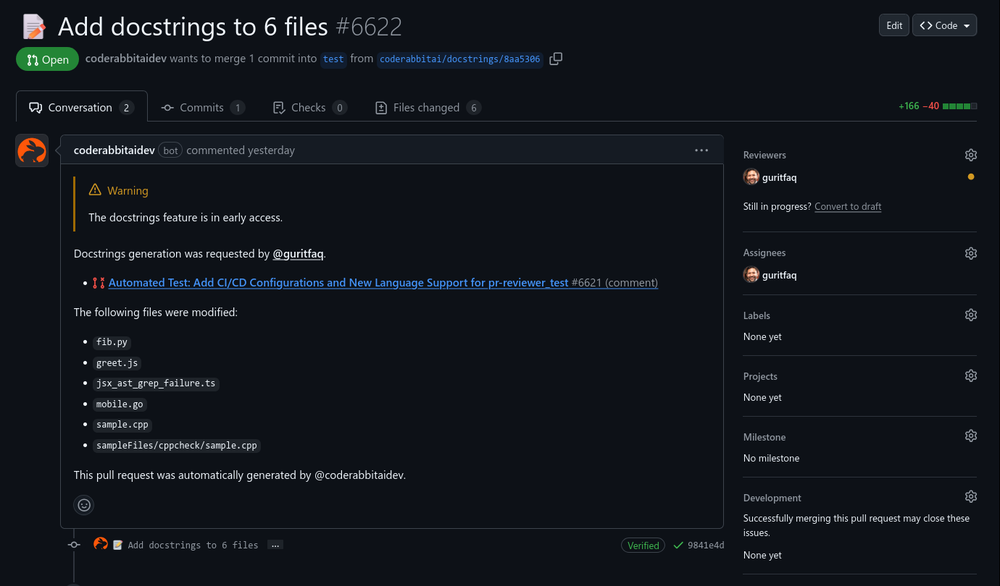 Reducing manual efforts in first-pass during code-review process helps speed up the "final check" before merging PRs
 -
28,684392v1.0 released 11mo agoFree + from $35/mo
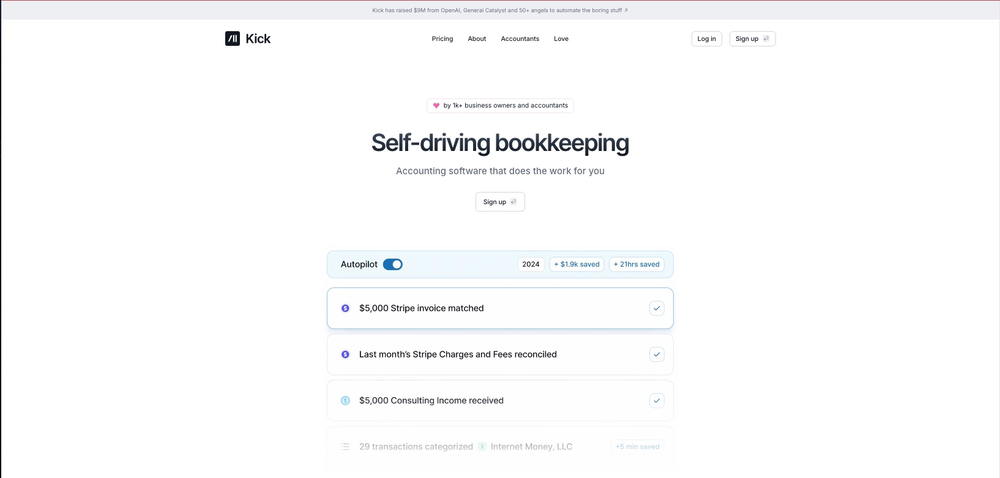 This team took the time to understand the industry, problem and its users and designed a perfectly engineered solution. Kudos.


7 alternatives to Data Model Diagrams for Data visualization
-
 Chat with your data to get beautiful visualization.32,971175v2.0 released 6mo agoFree + from $75/yr
 -
 Smart insights for business, stunning visuals for creators.25,61088Released 3mo ago100% FreeI felt there is need of more ready made templates. But, it does what it claims. I chose one question suggested by the AI agent, and it created the infographics in few seconds. It's cool. Saving it for future reference.
 -
 Turn Data into Stunning Charts in Seconds20,46823Released 2mo agoFree + from $20/moI was just trying to get a quick graph showing population evolution over the last 30 years, didn’t have the dataset ready, so I was hoping the tool could auto-fill something reasonable. But it literally gave me three values. Three?? For 30 years?? What kind of trend can I possibly see with that? If the tool offers to research the data, it should at least offer a full timeline. And when I pasted the data I found, it created a literally bar chart???
 -
 Generate visualizations from data using AI4,04719Released 2y ago100% Free
 -
 Supercharge Power BI dashboards with AI-driven insights3,61736Released 2y agoFree + from $15/mo
 -
 Turn complex data into clear insights with AI.2,46551Released 1y agoFree + from $10/mo
 -
 Visualize data effortlessly with AI-powered insights.2,06923Released 1y agoNo pricing


If you liked Data Model Diagrams
Featured matches
-
 10X AI Adoption with Your Change Management Copilot; for digital transformation consultantsOpen5,2632Released 4d agoFrom $675.23/yr
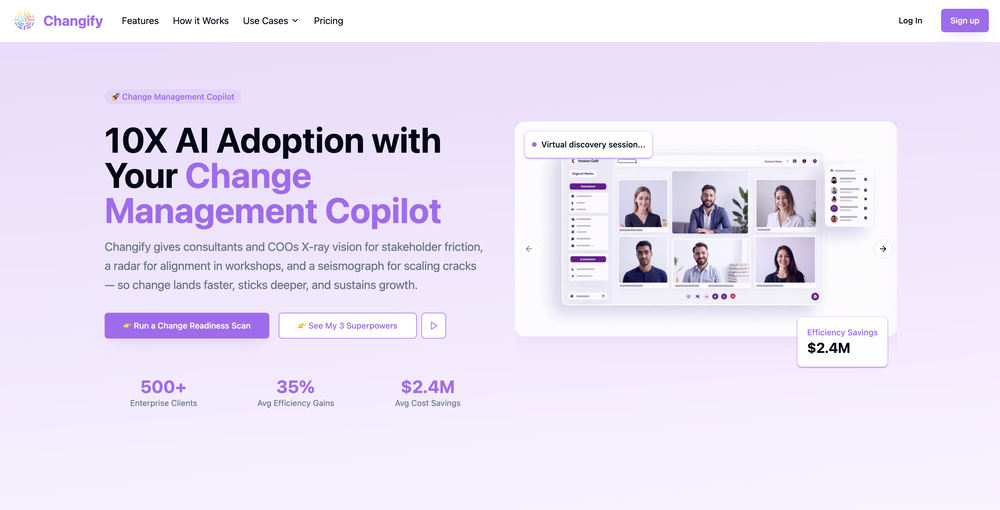
-
8,843106Released 5d agoNo pricing
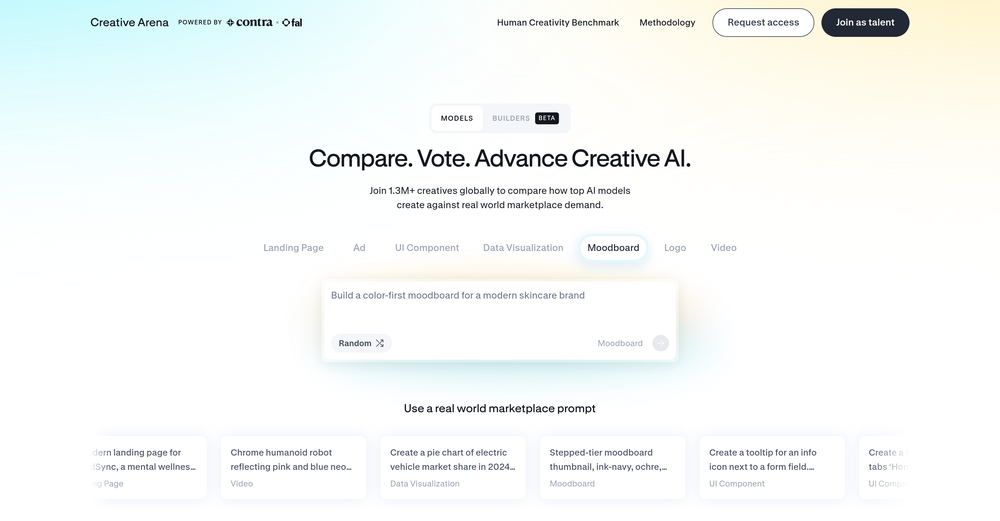 The leading generative media models on fal combined with top-earning real-world creative talent on Contra is a powerful combination. Feedback to fuel the future of creative ai.
 -
7,13349Released 6mo agoFree + from $7.99/mo
 It’s a powerful and intuitive tool that simplifies complex tasks, boosts productivity, and makes managing work smoother than ever. Highly recommended!
 -
15,87337v2.2 released 18d agoFree + from $11.48/mo

-
1,10025Released 3mo agoNo pricing
 It greatly supported my R&D work by helping me tackle technical challenges and prepare reports.
 -
 Open4489Released 1mo agoFree + from $7.5/mo
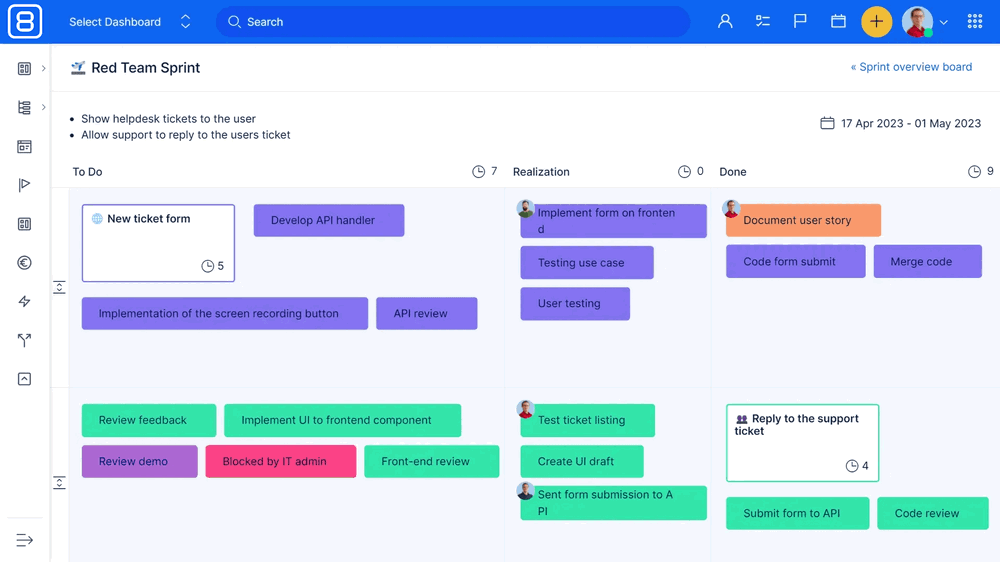


How would you rate Data Model Diagrams?
Help other people by letting them know if this AI was useful.