Go to section
Spotlight![]() SureThing.io - "OpenClaw" for BeginnersTask automation
SureThing.io - "OpenClaw" for BeginnersTask automation
The front page of AI.Used by 90M+ humans.

Generate image
Tasks
Generate text
Free mode
Trending
Leaderboard
Characters
 Mini tools
New
Featured
Lists
Agents
Requests
Jobs
Map
Newsletter
Starter pack
Free tools
Speech to text
Text translator
Remove background
Settings
Edit profile
My tools
Gallery
Dashboard
Inbox
Get featured
Contact TAAFT
For you
Popular
Job impact index
Most saved
Affiliate program
Submit AI tool
Notification preferences
Glossary
Home
Timeline
My profile
Create tool
Deals
Companies
Models
Robots
Papers
Fundraises
Devices
Organizations
Events
Prompt Pack
Merchendise
APIs
Features
Tools
Countries
Collections
Videos
News
Investors
Repositories
Modalities
Mini tools
New
Featured
Lists
Agents
Requests
Jobs
Map
Newsletter
Starter pack
Free tools
Speech to text
Text translator
Remove background
Settings
Edit profile
My tools
Gallery
Dashboard
Inbox
Get featured
Contact TAAFT
For you
Popular
Job impact index
Most saved
Affiliate program
Submit AI tool
Notification preferences
Glossary
Home
Timeline
My profile
Create tool
Deals
Companies
Models
Robots
Papers
Fundraises
Devices
Organizations
Events
Prompt Pack
Merchendise
APIs
Features
Tools
Countries
Collections
Videos
News
Investors
Repositories
Modalities

▼ Popular
Visualize
Free mode
100% free
Freemium
Free Trial
Other tools
-
Tyga Hero🙏 3 karmaMar 26, 2024@GPTChartDumber than a box of hair. Asked for a break even analysis chart. Fed it clear fixed costs, variable costs, net operating income AND ROI percentages. Even hinted that the break even point was between years six and seven. Dude took five minutes to draw a line across the "0" plane labeled "costs" and a revenue line crossing through where I suggested the break even point is. The scale was between 0.2-1.6 USD. No, I am not running a business for ants.
-
 Your guide to creating dynamic music visualizers!Open
 -
 Open
Open - Spotlight
 SureThing.io - "OpenClaw" for BeginnersTask automation
 -
 Open
Open - Didn't find the AI you were looking for?
-
 Open
Open -
 Visualizing and safeguarding your year's progress.Open
 -
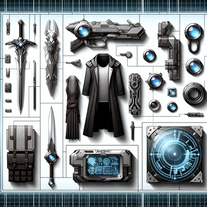 Visualize items for characters with photo-realistic images.Open
 -
 Visualize and manifest your desires with the Law of Attraction.Open
 -
 Open
Open -
 Weaving words and images into thought tapestries.Open
 -
 Open
Open


