

▼ Top rated
Data-visualization
Free mode
100% free
Freemium
Free Trial
Featured matches
-
 Saverio Pulizzi🛠️ 1 tool 🙏 2 karmaFeb 20, 2026@DenovoThanks for your feedback! We are also shipping some exciting new features this month!
 -
-

-
 AI-powered analytics that unlock smarter business insights.Open
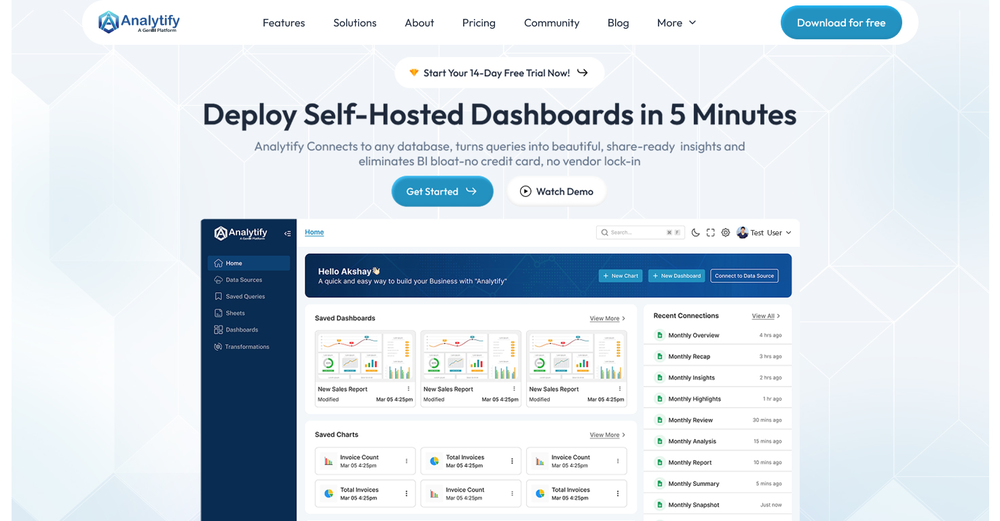 I used Analytify and found it incredibly easy to set up and integrate with Google Analytics, giving me real-time stats and page-level insights without needing any coding knowledge.
 -
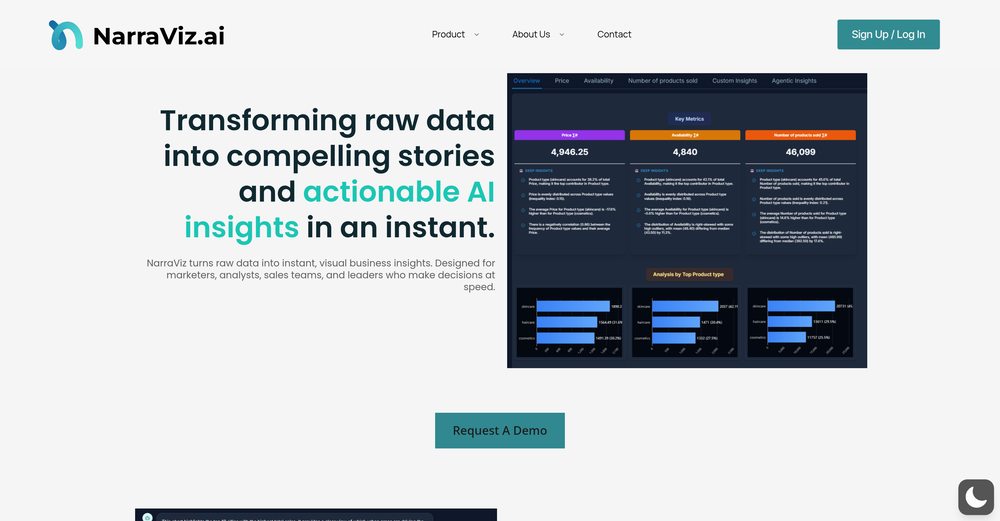
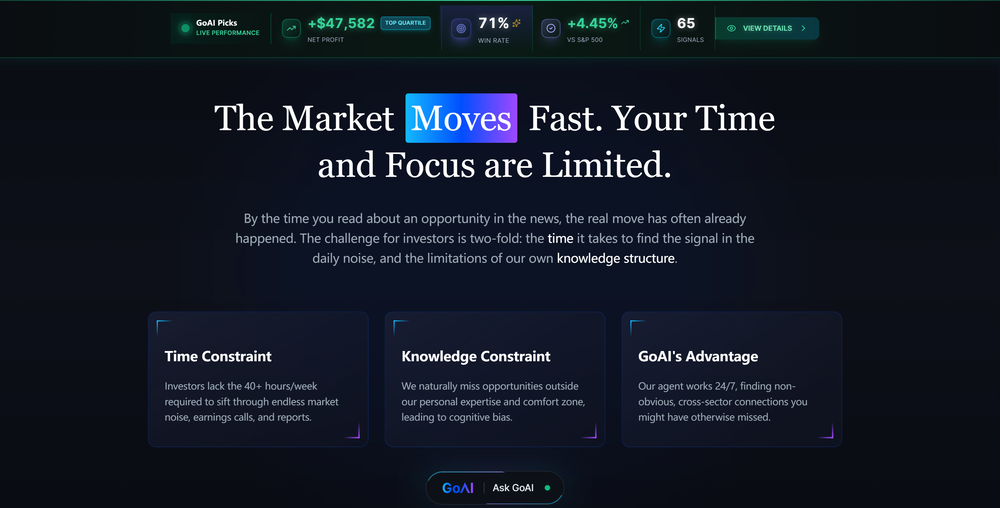 GoAI turns market noise into transparent, actionable investment logic. Go check your favorite stock for an instant deep-dive and see what the AI reveals. Feedback welcome!
 -
 UI Experience is fast & good with free account limited data (100 csv records) but no 3rd party integrations and limited data connection and no 3D /funnel many more chart visualizations are missing.
 -
 👋 Hey, I'm the founder of Flowova! We built this because we were tired of spending hours dragging boxes in traditional flowchart tools. A few things you might not know: - Works with anything — text, images, PDFs, Word, PPT, Excel, even photos of whiteboard sketches - 40+ themes designed for presentations - Full Mermaid code support for developers Happy to answer any questions! 🚀
 -
-

-


Other tools
-
-
It greatly supported my R&D work by helping me tackle technical challenges and prepare reports.
-
I really gotta let my heart out, got so many great reviews from my peers. It has helped me make my school work so much easier. I work with little children so when i make it cartoonish it's giving me the best one's yet.
- Sponsor
 MongoDB - Build AI That Scales🗄️ Database
 -
First AI data app I see that can connect databases and my GA4/Shopify APIs at the same time. Highly recommend if you have an ecommerce store!
-
Hi Taaft community! I’m the creator of ConceptViz. We built this tool specifically for educators and researchers who deal with complex information daily. ConceptViz uses AI to instantly transform dense lesson plans, curriculum notes, or research frameworks into clear, structured diagrams. Our goal is to help K12 teachers make abstract concepts tangible for students and to help researchers map out logical workflows without the manual drudgery of drawing. I’d love to hear how this fits into your academic or classroom workflow—your feedback will help us build a better tool for the education community! 🚀
-
Displayr has become an essential tool for survey data analysis. By leveraging advanced AI integration, the platform offers a user-friendly, low-code solution for analyzing survey data. Users can efficiently create presentations while working on data analysis within the same interface, eliminating the hassle of transferring numbers from Excel to PowerPoint.
- Didn't find the AI you were looking for?
-
-
I’d say this is one of the best chatbots I’ve used so far. The side-by-side comparison view is super handy for spotting bias and made-up, and the custom bots actually have decent memory, which is rare. Just a heads up: no image generation or voice mode. Other than that, it’s pretty solid.
-
-
 Open
Open


Post


