
ConceptViz
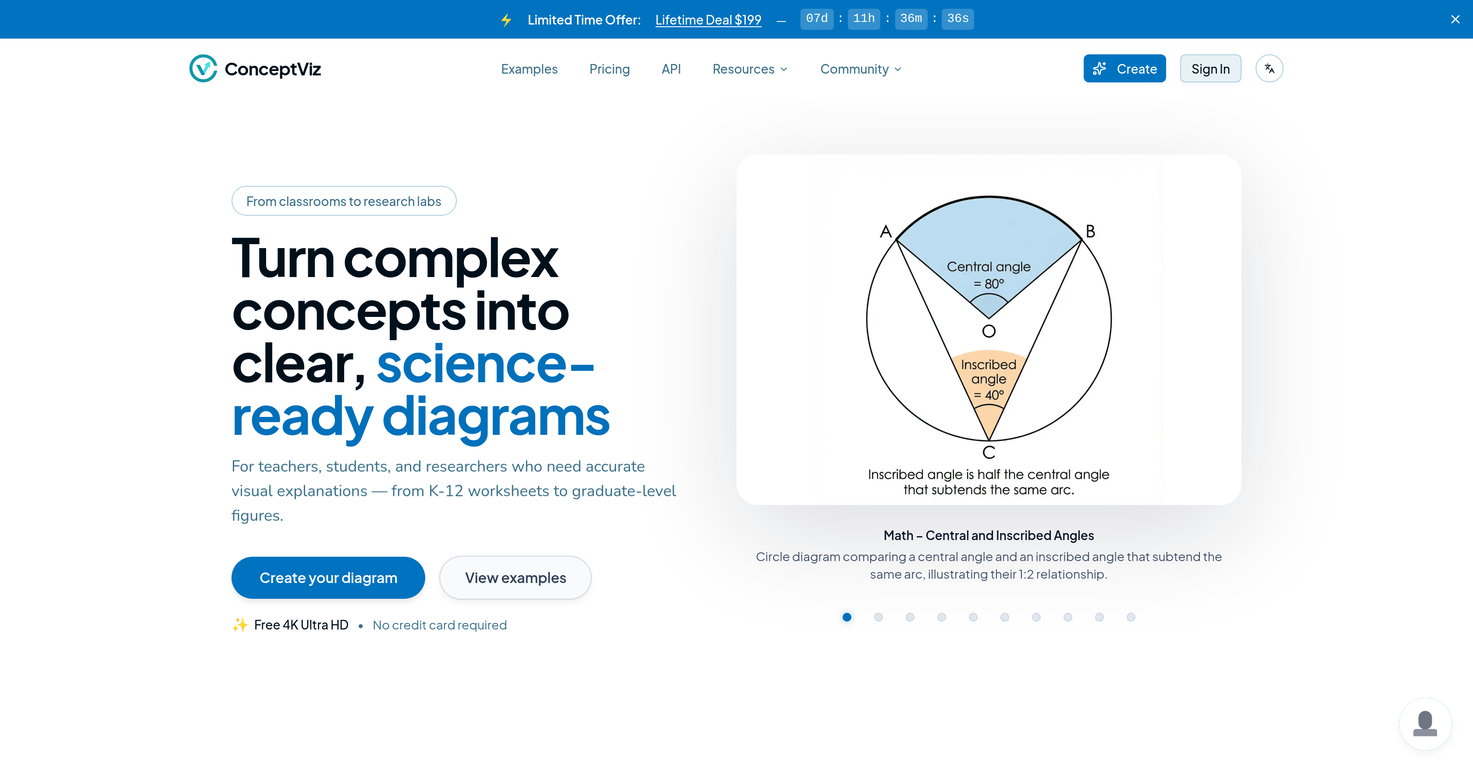
 Turn complex concepts into clear, science-ready diagrams
Go to 📊 Diagrams
 AI Diagram Maker
 DiagramGPT by Eraser
 Diagramming
 Dreamspace.art
 Tenorshare AI Diagrimo
 Mermaid Chart
 DGM
DGM
 AI Diagram Generator
 EdrawMax
 Mermaid Viewer
 DG Diagram-Generator
 Creately VIZ
 Clipbard
 Draft1
 Lucidchart
 Free Image Diagram Generator
 Diagram Generator
 T-Driven DIAGRAM
 Data Flow Diagrams Generator
 Advanced Flowchat Generator
42,539
41,475
23,659
14,921
9,229
6,810
3,354
2,567
2,401
1,495
878
825
743
707
118
47
44
36
28
25
Go to 🚀 Productivity
📚
Knowledge
(248)
🔍
Research
(181)
📧
Email
(144)
💼
Personal assistant
(105)
🤖
Task automation
(100)
🔎
Search
(87)
📋
Task management
(85)
📝
Notes
(51)
🌐
Web browsing
(47)
💻
Operating systems
(41)
🎯
Goals
(31)
🔎
Problem solving
(24)
⌛
Time management
(20)
🗄️
Workspace organization
(10)
📈
Productivity advice
(9)
📝
Form filling
(7)
 TheLibrarian.io
 Supernormal App
 Saidar
 MiroAI
 Collate
 Runable
 ComputerX
 Slashspace (Formerly RabbitHoles AI)
 AiAssistWorks - GPT Gemini Claude AI for Sheets Docs Slides
 ConsoleX AI
 Ask Steve
 Kolva
Kolva
 Alfred by Simbli.ai
 Affint
 Octofy
 Sup AI
 BrowseWiz
 ZeroTwo
 Support Flow
 Hyperis
644,758
204,276
133,475
131,584
130,874
125,251
124,380
119,948
113,820
68,746
52,402
44,126
43,588
40,330
39,586
37,315
36,868
36,300
33,759
30,457
Go to 📚 Knowledge
📰
News
(127)
🗺️
Knowledge maps
(70)
📚
Knowledge bases
(22)
 Constella
 Cerebro
 Keymate.AI
 everfind | AI workspace
 MyMemo
 ArcaNotes
 Keepi
Keepi
 Aethera
 Quench.ai
 Cortex | BodhiGPT
 Guru
Guru
 curioAI
 Histre
 Ask by Slite
 Perfect Wiki
 Grokipedia
 Paperbook
 IKI AI
 Ariglad
 Tettra
40,598
30,877
11,546
3,649
3,594
3,517
2,920
2,418
2,234
2,203
2,165
1,605
1,543
1,488
1,295
1,204
1,188
1,004
987
880
Inputs:
Outputs:
Turn complex concepts into clear, science-ready diagrams
Overview
Overview
ConceptViz is an AI-powered science diagram generator for teachers, students, and researchers. It turns plain-English prompts into clear, labeled diagrams for lessons, worksheets, slides, lab reports, research figures, posters, and study materials.The product is built for STEM topics including biology, chemistry, physics, earth and space science, math, anatomy, circuits, optics, and research-level scientific visuals. Users can describe the concept they need, choose the subject or output format, attach reference images or documents when helpful, and generate a ready-to-use visual in seconds.
ConceptViz focuses on scientific structure, readable labels, classroom-friendly clarity, and publication-ready export quality. Outputs are designed for slide decks, printable worksheets, classroom projectors, academic documents, and large-format posters. The platform supports high-resolution JPEG downloads, 2K and 4K output, editable SVG vector export on paid plans, and a growing library of 100+ purpose-built diagram generators.
Unlike generic AI image tools, ConceptViz is optimized specifically for educational and scientific diagrams: clean layouts, legible annotations, subject and grade presets, and visuals that match how STEM concepts are actually taught or presented.
Key Features
- Ai Science Diagram Generation
- Editable Svg Export
- 2k And 4k High-resolution Output
- Reference Image And Document Guidance
- 100+ Specialized Diagram Generators
- Slide And Worksheet-ready Layouts
- Commercial Use License On Paid Plans
Show more
Releases
Get notified when a new version of ConceptViz is released
Notify me
January 8, 2026
Initial release of ConceptViz.
Author

@zane-miller-007
AI entrepreneur, full-stack engineer, who has launched and successfully run multiple SaaS products.
Follow
Pricing
Pricing model
Freemium
Paid options from
$5/unit
Billing frequency
Pay-as-you-go
Refund policy
Keeping you safe
Good to know
Top alternatives
-
 Create professional diagrams in seconds with AI.
 Timothy Unfried🙏 11 karmaFeb 23, 2026@AI Diagram MakerDidn't really do the graphs that i thought it would do. Good for simple graphs, like for a presentation
 -
 Generated engineering diagrams.nice! does exatly what i wanted it to do, takes text, makes a nice looking diagram.
 -
 Instantly design UML & workflows with AIIsn't it possible that when downloading a diagram from it, the diagram to have white background rather than black background.
 -
 Visualize and edit prompts effortlessly.
 -
 Turn text into visuals instantly.Really useful tool here. Saves a lot of time when creating diagrams. Made a video about it here: https://www.youtube.com/watch?v=ClySYyEBvno
 -
 Visualize complex data with simple charts


#906
2
0


