Go to section
Spotlight![]() SureThing.io - "OpenClaw" for BeginnersTask automation
SureThing.io - "OpenClaw" for BeginnersTask automation
The front page of AI.Used by 90M+ humans.

TAAFT Tutorial
Generate image
Tasks
Generate text
Free mode
Trending
Leaderboard
Characters
 Mini tools
New
Featured
Lists
Agents
Requests
Jobs
Map
Newsletter
Starter pack
Free tools
Speech to text
Text translator
Remove background
Settings
Edit profile
My tools
Gallery
Dashboard
Inbox
Get featured
Contact TAAFT
For you
Popular
Job impact index
Most saved
Affiliate program
Submit AI tool
Notification preferences
Glossary
Home
Timeline
My profile
Create tool
Deals
Companies
Models
Robots
Papers
Fundraises
Repositories
Devices
Organizations
Events
Prompt Pack
Merchendise
APIs
Features
Tools
Countries
Collections
Videos
Mini tools
New
Featured
Lists
Agents
Requests
Jobs
Map
Newsletter
Starter pack
Free tools
Speech to text
Text translator
Remove background
Settings
Edit profile
My tools
Gallery
Dashboard
Inbox
Get featured
Contact TAAFT
For you
Popular
Job impact index
Most saved
Affiliate program
Submit AI tool
Notification preferences
Glossary
Home
Timeline
My profile
Create tool
Deals
Companies
Models
Robots
Papers
Fundraises
Repositories
Devices
Organizations
Events
Prompt Pack
Merchendise
APIs
Features
Tools
Countries
Collections
Videos

▼ Popular
Graphc
Free mode
100% free
Freemium
Free Trial
Featured matches


Other tools
-
Harishma Reghu🙏 7 karmaJan 13, 2024@Grapha AISuper useful tool that’s reduced my job by 80%
-
This one was really nice. In that it could also generate a white paper to go with the diagram
-
-
I wasn't able to use this one (I have my API key)
- Spotlight
 SureThing.io - "OpenClaw" for BeginnersTask automation
 -
poor tool doesn't take your prompts correctly i asked for specific colors and still gave me colors i didn't want even when asked not to.. waste of time
-
they support exporting to multi-sites now. got a lot of other improvements too, it's pretty great.
-
-
 Open
Open -
- Didn't find the AI you were looking for?
-
Great tool for getting some initial information about your data, especially in the beginning phase when your main goal is to explore your data
-
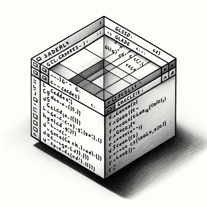
 Make Better Decisions with Data-Driven Charts, Clear Explanations, and Insightful AnalysisOpen
 -
I was just trying to get a quick graph showing population evolution over the last 30 years, didn’t have the dataset ready, so I was hoping the tool could auto-fill something reasonable. But it literally gave me three values. Three?? For 30 years?? What kind of trend can I possibly see with that? If the tool offers to research the data, it should at least offer a full timeline. And when I pasted the data I found, it created a literally bar chart???
-
 AI-powered Instagram images that captivate and engage.Open
 -
I want a logo for a traditional Persian carpet workshop in red color.
-
 AI-powered viral graphic design for trending content.Open
 -
 Transform ideas into crisp, scalable digital illustrations.OpenChanged the prompt to improve results.
 -
 Openquick n easy to use, great results with upscaling option. great tool. 5/5
 -
-
 Open
Open -
 Create social media-ready visuals with perfect text rendering.Open
 -
 Create scalable vector graphics with precision and AI-powered speed.Open
 -
 AI-powered digital artist creating captivating holiday graphics.Open
 -
Dumber than a box of hair. Asked for a break even analysis chart. Fed it clear fixed costs, variable costs, net operating income AND ROI percentages. Even hinted that the break even point was between years six and seven. Dude took five minutes to draw a line across the "0" plane labeled "costs" and a revenue line crossing through where I suggested the break even point is. The scale was between 0.2-1.6 USD. No, I am not running a business for ants.
-
 Open
Open -
 Open
Open -
 Open
Open -
 Open
Open -
 Open
Open -
 Crafting custom cover images for your social media.Open
 -
 Automatically tile all professionals and equipment.Open
 -
 Open
Open -
 Helping beginners grasp OpenGL 4.6 concepts and terminology.Open
 -
 Helps beginners understand DirectX 11 concepts and terminology.Open
 -
 Helps beginners understand Vulkan concepts and terminology.Open
 -
 Creating unique art from your photos and ideas.Open
 -
 Demystifying DirectX 12 programming for beginners.Open


