

▼ Latest
Image chart analysis
Free mode
100% free
Freemium
Free Trial
Featured matches
-
 Just type what you need — AI fills Sheets™, Docs™, and Slides™Open79,420159v2.0.0 released 5mo agoFree + from $5/mo
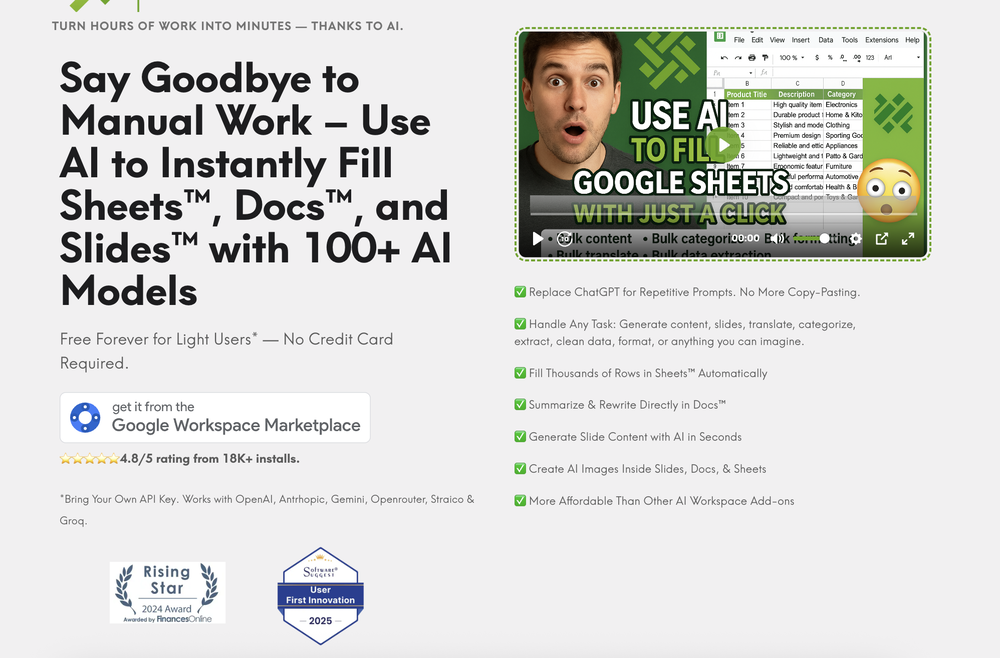 AiAssistWorks Contact🛠️ 1 tool 🙏 24 karmaAug 19, 2025@AiAssistWorks - GPT Gemini Claude AI for Sheets Docs SlidesJust type what you need — AI fills Sheets™, Docs™, and Slides™. FREE Forever with your API key for up to 100 execution per month! Zero formula typing, natural language instructions, zero complexity. Fill spreadsheets, create and edit documents, generate slide presentations, create images, and more.

Verified tools
-
21,21686Released 2y agoNo pricingI really value the sentiment analysis tool—it simplifies understanding customer feedback by picking up on their emotions. Plus, the way it groups comments into topics is super helpful for decision-making.
-
13,910160Released 2y agoFree + from $14/mo
-
14,55683Released 7mo agoFree + from $10/moI had to tweak a few things to match my brand style, but overall it saved me a ton of time. Definitely handy if you need something fast and professional-looking.
-
14,507131Released 2y agoFree + from $16.77/moIt works for me, might’ve been a temporary issue. Give it another try!
- Sponsor:Higgsfield AI - Video effects
-
14,16610Released 1mo agoFree + from $8/mo
-
29,78398Released 4mo agoFree + from $180I felt there is need of more ready made templates. But, it does what it claims. I chose one question suggested by the AI agent, and it created the infographics in few seconds. It's cool. Saving it for future reference.
-
46,039231Released 1y agoFrom $150


Other tools
-
2,88922Released 1y ago100% Free
-
26,507205v1.3 released 7mo agoFree + from $5/moThis one was really nice. In that it could also generate a white paper to go with the diagram
-
21,54724Released 3mo agoFree + from $20/moI was just trying to get a quick graph showing population evolution over the last 30 years, didn’t have the dataset ready, so I was hoping the tool could auto-fill something reasonable. But it literally gave me three values. Three?? For 30 years?? What kind of trend can I possibly see with that? If the tool offers to research the data, it should at least offer a full timeline. And when I pasted the data I found, it created a literally bar chart???
-
3,00248Released 8mo agoFree + from $4.99/mo
-
49910Released 1y ago100% Free
-
2,34037Released 1y ago100% Free
-
22,303163Released 2y agoFree + from $12/mo
-
1,90826Released 2y agoFree + from $15/moGreat tool for getting some initial information about your data, especially in the beginning phase when your main goal is to explore your data
-
9,69346Released 1y agoFree + from $4.95/moSays you can have 3 free per day without logging in, but wanted to charge for my first use
-
1,79628Released 1y agoFrom $9/mo
-
5,64418Released 2y agoFree + from $6.67/mo
-
70212Released 1y agoFrom $39
- Didn't find the AI you were looking for?
-
33,482386Released 2y agoFree + from $5/moIt took me less than 20 minutes to create infographic perfection- all the other AI design sites I tried, and I tried them all, weren't able to give me what I wanted in 1 way or another. Outline Ninja helped me create my infographic
-
4,1594Released 2y agoFrom $49/mo
-
1,1456Released 1y agoFree + from $1.99
-
5,97355Released 2y agoFree + from $168/yr
-
12,38373153Released 2y ago100% FreeDumber than a box of hair. Asked for a break even analysis chart. Fed it clear fixed costs, variable costs, net operating income AND ROI percentages. Even hinted that the break even point was between years six and seven. Dude took five minutes to draw a line across the "0" plane labeled "costs" and a revenue line crossing through where I suggested the break even point is. The scale was between 0.2-1.6 USD. No, I am not running a business for ants.
-
8,91538Released 2y ago100% Free


Post


