

▼ Most saved
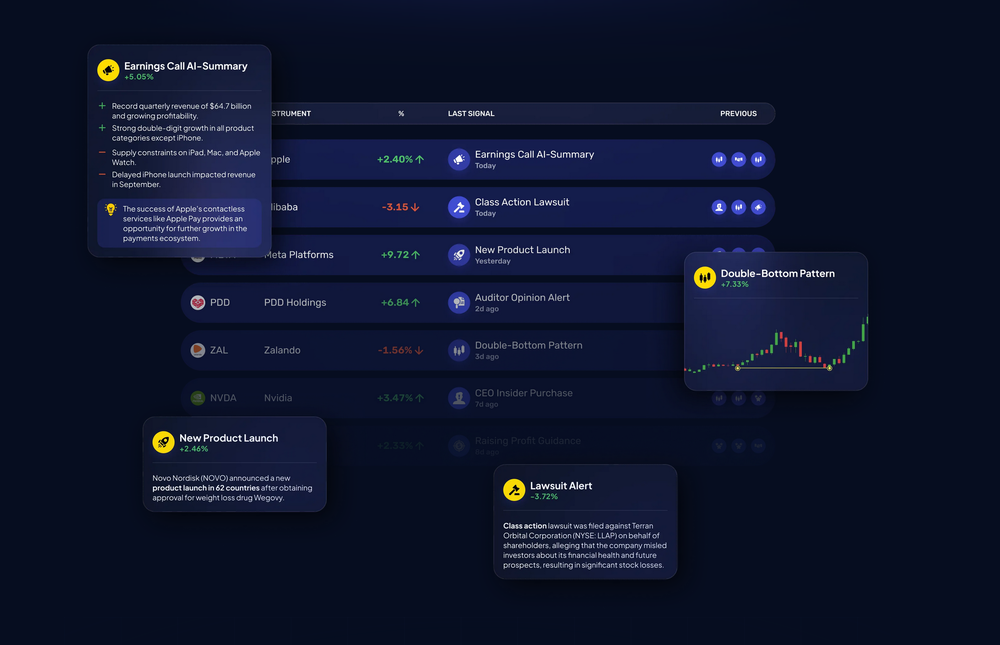
Stock chart patterns from an image
Free mode
100% free
Freemium
Free Trial
Featured matches
-
28,689363Released 1y agoFree + from $13.90/mo
 Builder🙏 122 karmaSep 27, 2024Ideal for stock-watchlist and not missing trade setups that correspond to my strategy.
 -
13,34820Released 3mo agoFree + from $16/mo
 This looks absolutely amazing so far! Creating loop diagrams in Photoshop used to eat up so much of my time - this feature is a real time-saver. The platform offers other tools too, definitely worth exploring.


Other tools
-
82,5571,512v1 released 2y agoFrom $12/mo
-
 Empower your investment strategies with AI signals, option flow data, and advanced chart patterns.Open15,491216Released 2y agoFree + from $49/moOver-priced for what it promises to do. Other AI powered services, at more affordable prices, or cheaper, some with incredible track records and scientists with great track records.
 -
26,466205v1.3 released 6mo agoFree + from $5/moThis one was really nice. In that it could also generate a white paper to go with the diagram
-
12,036184Released 2y agoFree + from $29/mo
- Sponsor:Rocket
-
28,12196Released 4mo ago100% FreeI felt there is need of more ready made templates. But, it does what it claims. I chose one question suggested by the AI agent, and it created the infographics in few seconds. It's cool. Saving it for future reference.
-
20,79186Released 2y agoNo pricingI really value the sentiment analysis tool—it simplifies understanding customer feedback by picking up on their emotions. Plus, the way it groups comments into topics is super helpful for decision-making.
-
5,46463Released 2y ago#16 in Trending
-
26,22662Released 1y agoFree + from $5
-
4,84955Released 2y agoFree + from $2.99
-
3,04252Released 2y agoFree + from $12.99/moRequires an account and doesn't even include single sign in. I'm negatively bias towards any app that doesn't include single sign in. Any modern app should have single sign in.
-
2,92547Released 8mo agoFree + from $4.99/mo
-
2,09537Released 1y ago100% Free
- Didn't find the AI you were looking for?
-
2,79136Released 1y agoNo pricing
-
21,23223Released 3mo agoFree + from $20/moI was just trying to get a quick graph showing population evolution over the last 30 years, didn’t have the dataset ready, so I was hoping the tool could auto-fill something reasonable. But it literally gave me three values. Three?? For 30 years?? What kind of trend can I possibly see with that? If the tool offers to research the data, it should at least offer a full timeline. And when I pasted the data I found, it created a literally bar chart???
-
3,16922Released 2y agoNo pricing
-
1,34818Released 1y agoFree + from $6/mo
-
76215Released 1y agoFree + from $19/mo
-
2,18912Released 2y agoFrom $7.49/mo
-
82510Released 4y agoFrom $19/mo
-
2021Released 1y agoFree + from $10/mo
-
12,36973153Released 2y ago100% FreeDumber than a box of hair. Asked for a break even analysis chart. Fed it clear fixed costs, variable costs, net operating income AND ROI percentages. Even hinted that the break even point was between years six and seven. Dude took five minutes to draw a line across the "0" plane labeled "costs" and a revenue line crossing through where I suggested the break even point is. The scale was between 0.2-1.6 USD. No, I am not running a business for ants.


Post


