

▼ Latest
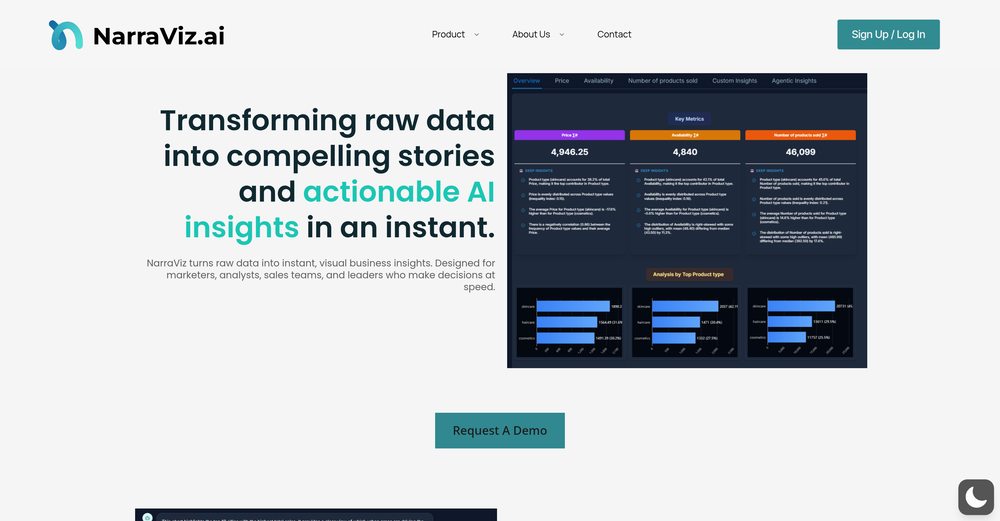
Visualise data
Free mode
100% free
Freemium
Free Trial
Featured matches

Verified tools
-
Harrison Oliver🙏 24 karmaJun 12, 2025@StatPeckerI felt there is need of more ready made templates. But, it does what it claims. I chose one question suggested by the AI agent, and it created the infographics in few seconds. It's cool. Saving it for future reference.
-
I really value the sentiment analysis tool—it simplifies understanding customer feedback by picking up on their emotions. Plus, the way it groups comments into topics is super helpful for decision-making.
-
- Sponsor
 MongoDB - Build AI That Scales🗄️ Database
 -
I can't help but rave about this product because of the level of craftsmanship in it; Vizly is made for data scientists, by data scientists, and it shows. Having tried various tools in the space, I can confidently say it's the best by a mile, the UX is silky smooth and will feel familiar to any data scientist, and yet it manages to supercharge your workflows - I gurantee you'll be a few times more productive, can't recommend it enough.
-
It is the ease of use for me. DataSquirrel is fast, the UI is super intuitive, and the guided analysis feature is highly convenient. I have officially moved from uploading CSV files from Google sheet to DataSquirrel. Within minutes, I can visualize my data and interpreting it becomes super simple.
-
Hi Taaft community! I’m the creator of ConceptViz. We built this tool specifically for educators and researchers who deal with complex information daily. ConceptViz uses AI to instantly transform dense lesson plans, curriculum notes, or research frameworks into clear, structured diagrams. Our goal is to help K12 teachers make abstract concepts tangible for students and to help researchers map out logical workflows without the manual drudgery of drawing. I’d love to hear how this fits into your academic or classroom workflow—your feedback will help us build a better tool for the education community! 🚀
-
-


Other tools
-
I was just trying to get a quick graph showing population evolution over the last 30 years, didn’t have the dataset ready, so I was hoping the tool could auto-fill something reasonable. But it literally gave me three values. Three?? For 30 years?? What kind of trend can I possibly see with that? If the tool offers to research the data, it should at least offer a full timeline. And when I pasted the data I found, it created a literally bar chart???
-
I am able to summarize a complex paper into a one-pager visual. Before this tool: hours of reading and summarizing. After this tool: I grasp something complex in seconds. Thank you!!!
-
Data narration and augmentation are valuable tools from datumfuse.ai
-
- Waitlist
- Didn't find the AI you were looking for?
-
-
 Open
Open


Post


