

▼ Most saved
Visualize text
Free mode
100% free
Freemium
Free Trial
Featured matches
-
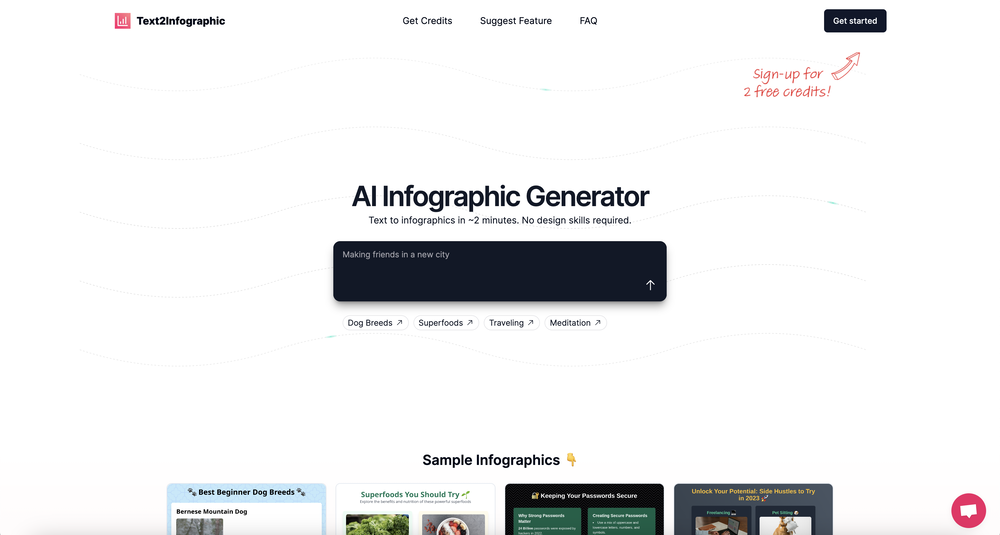 David Parsons🙏 5 karmaJun 15, 2024@Text to InfographicThis definitely has potential. The lack of control over what gets generated is annoying, in particular how it will insert meaningless graphs despite being provided with no data - there needs to be a way of preventing this. However, the fact that you can download the HTML and then edit yourself is a big plus. Unfortunately only having two credits to test it out didn't really give me a chance to find out what it could do.
 -


Other tools
-
It took me less than 20 minutes to create infographic perfection- all the other AI design sites I tried, and I tried them all, weren't able to give me what I wanted in 1 way or another. Outline Ninja helped me create my infographic
-
-
- Spotlight: Notis (Personal assistant)
-
I had to tweak a few things to match my brand style, but overall it saved me a ton of time. Definitely handy if you need something fast and professional-looking.
-
It does exactly what is expected and more. I asked it to create a map with pins for 30 addresses and it did exactly that within a few seconds. It has great customization options also.
-
Displayr has become an essential tool for survey data analysis. By leveraging advanced AI integration, the platform offers a user-friendly, low-code solution for analyzing survey data. Users can efficiently create presentations while working on data analysis within the same interface, eliminating the hassle of transferring numbers from Excel to PowerPoint.
-
I am able to summarize a complex paper into a one-pager visual. Before this tool: hours of reading and summarizing. After this tool: I grasp something complex in seconds. Thank you!!!
-
Combines knowledge graphs with AI, reveals main topics and gaps in a discourse.
- Didn't find the AI you were looking for?
-
They couldn’t generate zebras without their stripes on 3 separate tries. That’s basic f-ing shit.
-
I was just trying to get a quick graph showing population evolution over the last 30 years, didn’t have the dataset ready, so I was hoping the tool could auto-fill something reasonable. But it literally gave me three values. Three?? For 30 years?? What kind of trend can I possibly see with that? If the tool offers to research the data, it should at least offer a full timeline. And when I pasted the data I found, it created a literally bar chart???
-
-


Post


