
Data Visualization Expert
Data Visualization Expert is a GPT designed to conceptualize and produce graphs and charts from user-generated datasets. Its capability extends to implementing the most effective techniques for visual encoding and accessibility, ensuring that the visuals created are not only insightful but also user-friendly.
It can make recommendations for the type of visualization to use depending on the nature of the data and the expected audience, thereby optimizing the comprehension and interpretability of the data.
Users can request various types of visualizations, such as line charts, stacked bar charts, scatter plots, tree maps, histograms, and area charts, amongst others.
It can work with diverse data file formats such as CSV and txt files. The Data Visualization Expert GPT is nimble, user-oriented, and efficient, making it a valuable tool for data analysis and representation.
Releases
Pricing
Prompts & Results
Add your own prompts and outputs to help others understand how to use this AI.
-
75,264515v2.5 released 1mo agoFrom $500/mo

-
 Build smarter AI voice agents with the best speech recognition technologyOpen26,20923Released 1mo agoFree + from $0.24
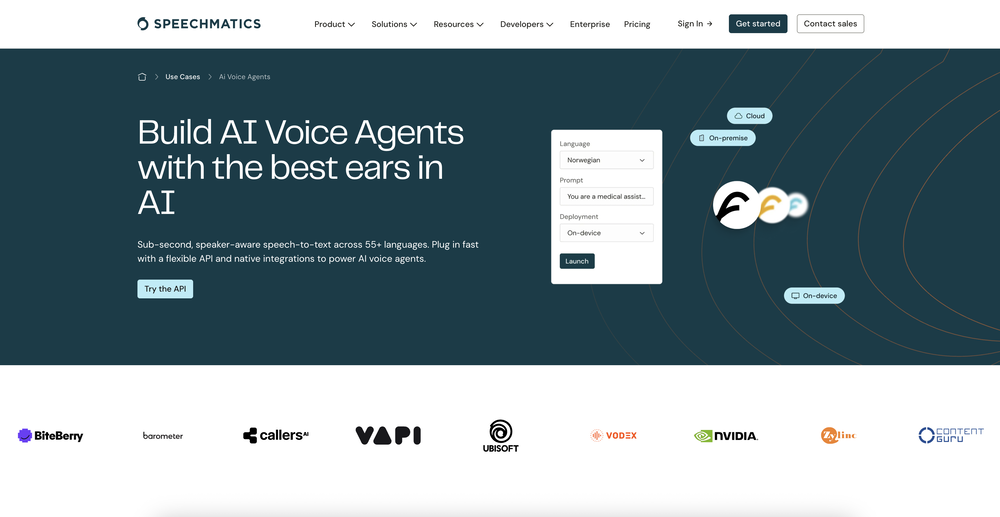 Computers should be allowed to TALK to us for free, like in the Star Trek TV series. Our future grandchildren will laugh at us for "paying" to use this everyday option, biting the hook to "monthly subscriptions" like gullible fish and then getting up to 60,000 characters per month" under the so-called Pro version ;-) This is crazy!


7 alternatives to Data Visualization Expert for Data visualization
-
 Chat with your data to get beautiful visualization.34,384175v2.0 released 7mo agoFree + from $75/yr
 -
 Smart insights for business, stunning visuals for creators.27,16896Released 4mo ago100% FreeI felt there is need of more ready made templates. But, it does what it claims. I chose one question suggested by the AI agent, and it created the infographics in few seconds. It's cool. Saving it for future reference.
 -
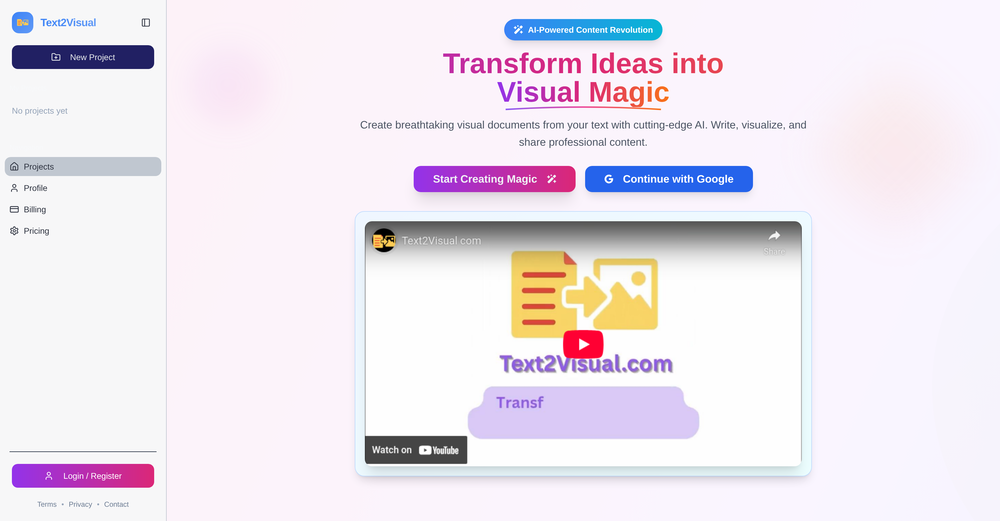
 Turn Data into Stunning Charts in Seconds21,03923Released 2mo agoFree + from $20/moI was just trying to get a quick graph showing population evolution over the last 30 years, didn’t have the dataset ready, so I was hoping the tool could auto-fill something reasonable. But it literally gave me three values. Three?? For 30 years?? What kind of trend can I possibly see with that? If the tool offers to research the data, it should at least offer a full timeline. And when I pasted the data I found, it created a literally bar chart???
 -
 Generate visualizations from data using AI4,07521Released 2y ago100% Free
 -
 Supercharge Power BI dashboards with AI-driven insights3,65736Released 2y agoFree + from $15/mo
 -
 Turn complex data into clear insights with AI.2,73451Released 1y agoFree + from $10/mo
 -
 Visualize data effortlessly with AI-powered insights.2,10426Released 1y agoNo pricing


If you liked Data Visualization Expert
Featured matches
-
5,3884Released 1d agoFree + from $7/mo
-
18,77248v2.2 released 1mo agoFree + from $11.48/mo

-
10,9396Released 3d agoFree + from $5/mo
-
8,2046Released 21h agoFree + from $25/mo
 Gave me cool looking dashboards and I like how I can select one of the dashboard elements and specifically query over it


Verified tools
-
20,52586Released 2y agoNo pricingI really value the sentiment analysis tool—it simplifies understanding customer feedback by picking up on their emotions. Plus, the way it groups comments into topics is super helpful for decision-making.


How would you rate Data Visualization Expert?
Help other people by letting them know if this AI was useful.