

▼ Latest
Candlestick charts
Free mode
100% free
Freemium
Free Trial
Featured matches
-
29,507371Released 1y agoFree + from $13.90/mo
 Builder🙏 122 karmaSep 27, 2024@MarketAlerts.aiIdeal for stock-watchlist and not missing trade setups that correspond to my strategy.
 -
 AI-powered prediction market picks delivered weekly for $10/monthOpen36,80325v3.1 released 2h agoFree + from $10/mo
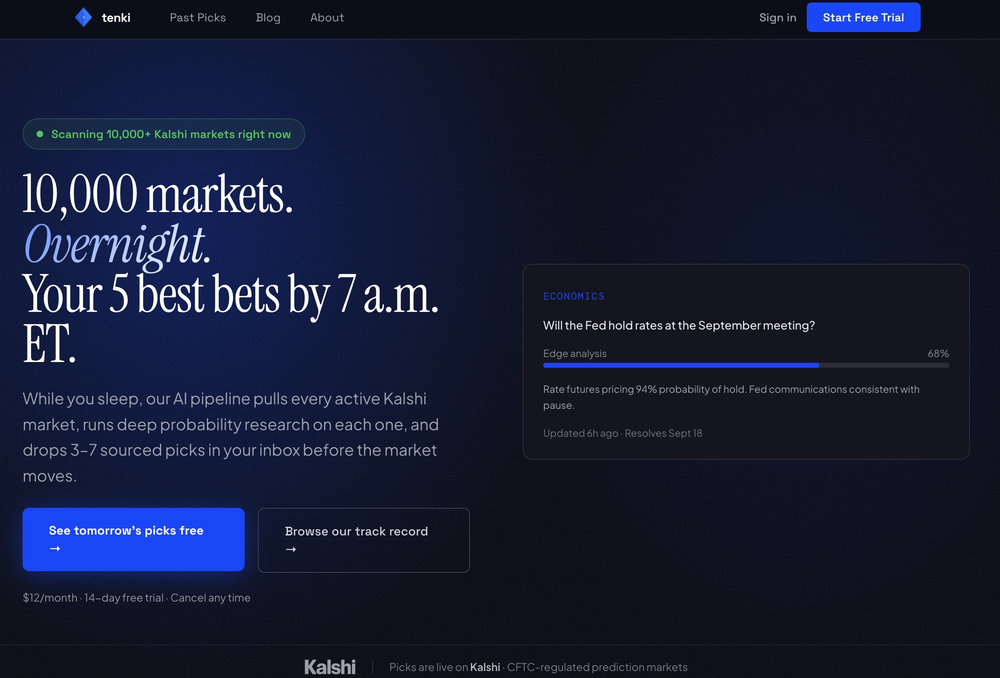 Tenki uses AI to forecast prediction markets like Polymarket and Kalshi, delivering weekly picks straight to your inbox for just $10/month. Start with a free 2-week trial and see if our 76% accuracy rate beats your gut feelings.


Verified tools
-
14,218182Released 2y agoFrom $27.30/mo
-
14,89010Released 2mo agoFree + from $8/mo
-
 Empower your investment strategies with AI signals, option flow data, and advanced chart patterns.Open15,632216Released 2y agoFree + from $49/moOver-priced for what it promises to do. Other AI powered services, at more affordable prices, or cheaper, some with incredible track records and scientists with great track records.
 -
20,257230Released 2y agoFrom $54.6/mo
- Spotlight: Video Music-Score by Vidsembly (Music)
-
29,07264Released 1y agoFree + from $5
-
21,82686Released 2y agoNo pricingI really value the sentiment analysis tool—it simplifies understanding customer feedback by picking up on their emotions. Plus, the way it groups comments into topics is super helpful for decision-making.
-
7,29188Released 1y agoFree + from $9.99/moThank you for you for your feedback, Shin! I'm thrilled you had a unique and great experience with Capital Companion. I work hard to provide an exceptional AI-powered financial assistant, and it's gratifying to know it's making a positive impact. Please don't hesitate to reach out if you have any additional thoughts or suggestions. Thanks again for choosing Capital Companion!
-
1,35334Released 2y agoNo pricing


Other tools
-
3,13849Released 9mo agoFree + from $4.99/mo
-
22,01624Released 4mo agoFree + from $20/moI was just trying to get a quick graph showing population evolution over the last 30 years, didn’t have the dataset ready, so I was hoping the tool could auto-fill something reasonable. But it literally gave me three values. Three?? For 30 years?? What kind of trend can I possibly see with that? If the tool offers to research the data, it should at least offer a full timeline. And when I pasted the data I found, it created a literally bar chart???
-
2,73938Released 1y ago100% Free
-
77915Released 1y agoFree + from $19/mo
-
1,94126Released 2y agoFree + from $15/moGreat tool for getting some initial information about your data, especially in the beginning phase when your main goal is to explore your data
-
10,622161Released 5y agoFrom $69/moterrible app had to get a refund the data is wrong and doesnt match up when you check with the brokers
-
26,794205v1.3 released 7mo agoFree + from $5/moThis one was really nice. In that it could also generate a white paper to go with the diagram
-
1,80828Released 1y agoFrom $9/mo
-
 Open2,65616Released 6mo agoFree + from $9.99/mo
 -
1,34811Released 2y agoFrom $9.99/mo
-
22,403163Released 2y ago#32 in Trending
-
 Expert in K-line analysis for professional tradersOpen6651518Released 2y ago100% FreeSimply explained support and resistance zones.good work.
 - Didn't find the AI you were looking for?
-
312472Released 2y ago100% Free
-
12,40773153Released 2y ago100% FreeDumber than a box of hair. Asked for a break even analysis chart. Fed it clear fixed costs, variable costs, net operating income AND ROI percentages. Even hinted that the break even point was between years six and seven. Dude took five minutes to draw a line across the "0" plane labeled "costs" and a revenue line crossing through where I suggested the break even point is. The scale was between 0.2-1.6 USD. No, I am not running a business for ants.


Post


