

▼ Latest
Excel to infographics
Free mode
100% free
Freemium
Free Trial
Featured matches
-
 Will Mitchell🛠️ 1 tool 🙏 10 karmaDec 19, 2025@ChartGen.ailooks awesome - congrats!
 -
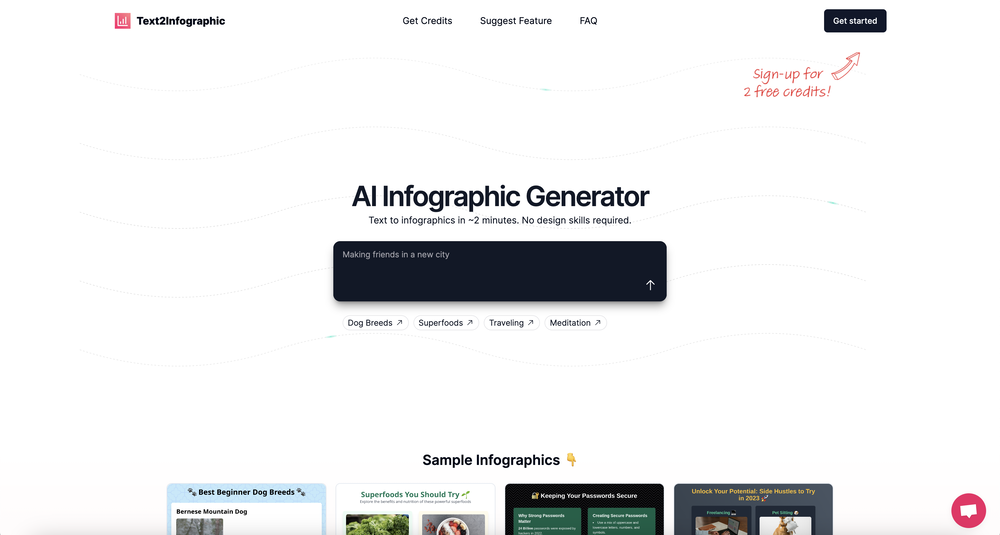 This definitely has potential. The lack of control over what gets generated is annoying, in particular how it will insert meaningless graphs despite being provided with no data - there needs to be a way of preventing this. However, the fact that you can download the HTML and then edit yourself is a big plus. Unfortunately only having two credits to test it out didn't really give me a chance to find out what it could do.
 -

-


Verified tools
-
I had to tweak a few things to match my brand style, but overall it saved me a ton of time. Definitely handy if you need something fast and professional-looking.
-
- Spotlight: Notis (Personal assistant)
-
I felt there is need of more ready made templates. But, it does what it claims. I chose one question suggested by the AI agent, and it created the infographics in few seconds. It's cool. Saving it for future reference.
-
This has got a super-positive future. After creating just one video, I could see that there would be a large use-case for most industries, including mine with Online Marketing. One thing I did notice was that assets that appear on screen often overlap each other. The same was apparent on most of the other videos in their showcase. Once they get over this hurdle, it'll be worth paying for, for sure.
-
 AI-powered Excel analysis and visualization in natural languageOpenTired of wrestling with complex formulas, spending hours cleaning data, and struggling to create the right charts? Excelmatic is a powerful web-based AI agent designed to revolutionize your relationship with spreadsheets.
 -
I got some free credits to try the app when I signed up, I could create a few great infographics
-
I really value the sentiment analysis tool—it simplifies understanding customer feedback by picking up on their emotions. Plus, the way it groups comments into topics is super helpful for decision-making.
-
It works for me, might’ve been a temporary issue. Give it another try!
-
I can't help but rave about this product because of the level of craftsmanship in it; Vizly is made for data scientists, by data scientists, and it shows. Having tried various tools in the space, I can confidently say it's the best by a mile, the UX is silky smooth and will feel familiar to any data scientist, and yet it manages to supercharge your workflows - I gurantee you'll be a few times more productive, can't recommend it enough.


Other tools
-
It took me less than 20 minutes to create infographic perfection- all the other AI design sites I tried, and I tried them all, weren't able to give me what I wanted in 1 way or another. Outline Ninja helped me create my infographic
-
Paid for monthly account to test it out. Site does not recognize the purchase.
-
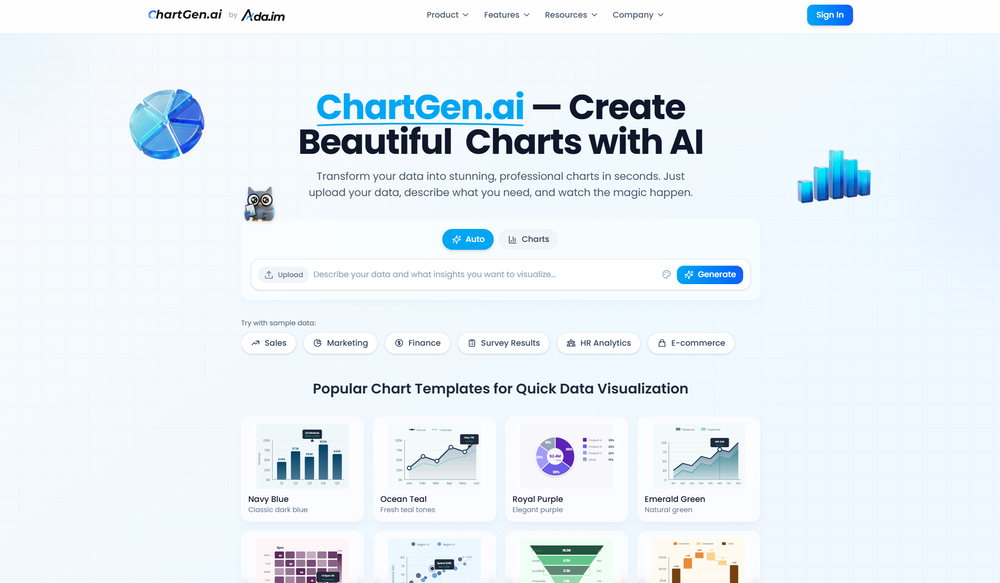
I was just trying to get a quick graph showing population evolution over the last 30 years, didn’t have the dataset ready, so I was hoping the tool could auto-fill something reasonable. But it literally gave me three values. Three?? For 30 years?? What kind of trend can I possibly see with that? If the tool offers to research the data, it should at least offer a full timeline. And when I pasted the data I found, it created a literally bar chart???


Post


