▼ Latest
Graphical input
Free mode
100% free
Freemium
Free Trial
Featured matches
-
8,67811Released 6d agoFree + from $7/mo
 Ezzaky Ab.🛠️ 6 tools 🙏 62 karmaOct 19, 2025V1.0 is live :)
 -
14,138156Released 1y agoFree + from $5
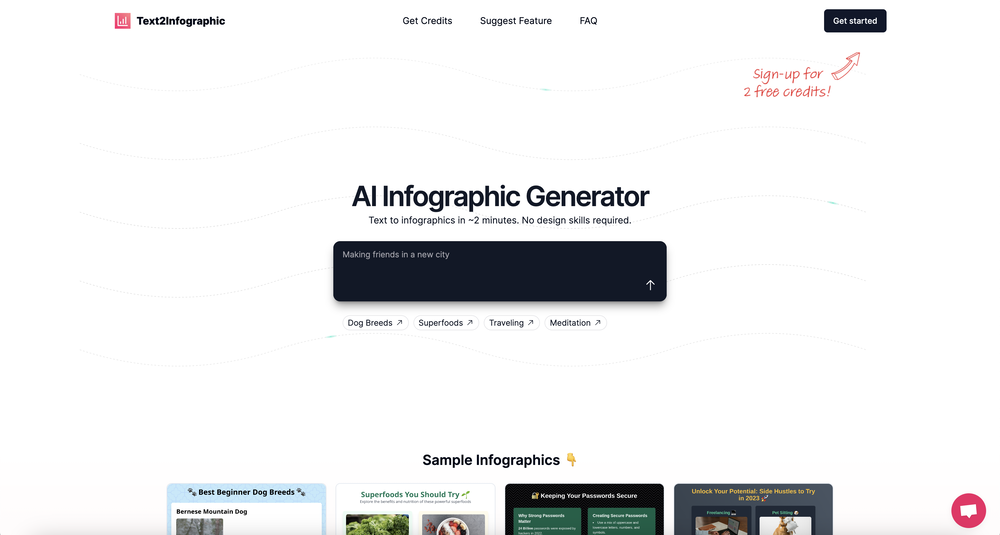
 This definitely has potential. The lack of control over what gets generated is annoying, in particular how it will insert meaningless graphs despite being provided with no data - there needs to be a way of preventing this. However, the fact that you can download the HTML and then edit yourself is a big plus. Unfortunately only having two credits to test it out didn't really give me a chance to find out what it could do.
Verified tools
-
1,49215Released 2y agoFree + from $49/mo
-
8,263115Released 1y agoFree + from $9.9/mo
-
45,348231Released 1y agoFrom $150
-
6,77480Released 6mo agoFree + from $5/mo
Other tools
- Sponsor:Rocket
-
4,08052Released 2y agoFrom $8.99/mo
-
22,235163Released 2y agoFree + from $12/mo
-
63412Released 1y agoFrom $39
-
3,06948Released 3y ago100% Free
-
1,88226Released 2y agoFree + from $15/moGreat tool for getting some initial information about your data, especially in the beginning phase when your main goal is to explore your data
-
2,05137Released 1y ago100% Free
-
8423Released 2y agoNo pricing
-
1,105137v1 released 3y agoFrom $10.00
-
17,314352Released 2y ago100% Free
-
3,06034Released 1y ago100% Free
-
7659Released 1y agoFree + from $10/mo
-
14,53370Released 3y agoNo pricing
- Didn't find the AI you were looking for?
-
44618Released 1y agoFree + from $4.9/mo
-
2,75828Released 10mo agoNo pricingThey couldn’t generate zebras without their stripes on 3 separate tries. That’s basic f-ing shit.
-
9,58220Released 2y ago100% Free
-
59511Released 1y agoNo pricing
-
26,451205v1.3 released 6mo agoFree + from $5/moThis one was really nice. In that it could also generate a white paper to go with the diagram
-
5,98968Released 2y agoNo pricingpowerful and free photo editor! packed with lots of functionalities.
-
19523Released 2y ago100% Free
-
12,36373153Released 1y ago100% FreeDumber than a box of hair. Asked for a break even analysis chart. Fed it clear fixed costs, variable costs, net operating income AND ROI percentages. Even hinted that the break even point was between years six and seven. Dude took five minutes to draw a line across the "0" plane labeled "costs" and a revenue line crossing through where I suggested the break even point is. The scale was between 0.2-1.6 USD. No, I am not running a business for ants.
Post


