

▼ Popular
Graphical input
Free mode
100% free
Freemium
Free Trial
Featured matches
-
14,383158Released 1y agoFree + from $5
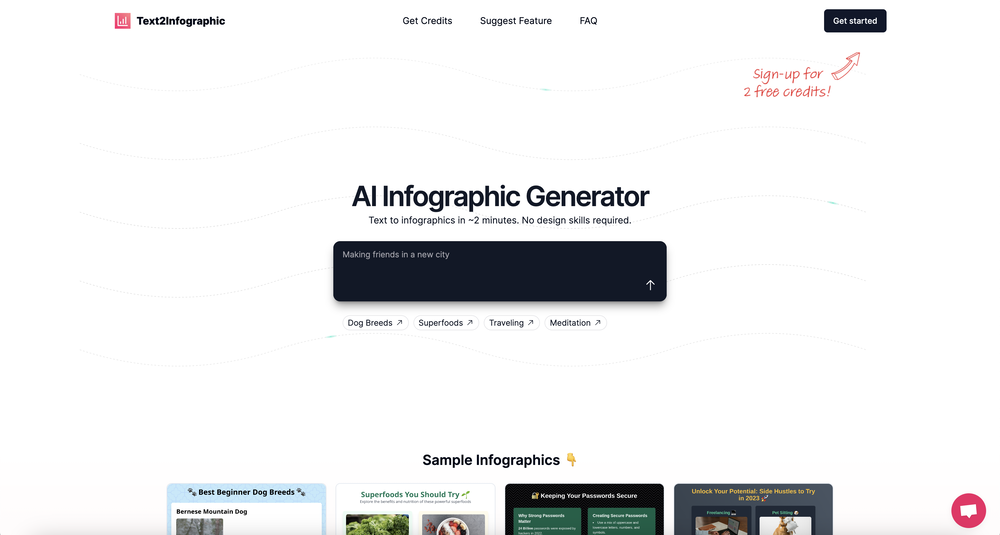 David Parsons🙏 5 karmaJun 15, 2024@Text to InfographicThis definitely has potential. The lack of control over what gets generated is annoying, in particular how it will insert meaningless graphs despite being provided with no data - there needs to be a way of preventing this. However, the fact that you can download the HTML and then edit yourself is a big plus. Unfortunately only having two credits to test it out didn't really give me a chance to find out what it could do.
 -
10,38414Released 21d agoFree + from $7/mo


Other tools
-
46,061231Released 1y agoFrom $150
-
26,512205v1.3 released 7mo agoFree + from $5/moThis one was really nice. In that it could also generate a white paper to go with the diagram
-
22,309163Released 2y agoFree + from $12/mo
-
17,337353Released 2y ago100% FreeI wasn't able to use this one (I have my API key)
- Sponsor:Higgsfield AI - Video effects
-
14,55170Released 3y agoNo pricing
-
9,69820Released 2y ago100% Free
-
8,613115Released 1y agoFree + from $9.9/mo
-
6,02368Released 2y agoNo pricingpowerful and free photo editor! packed with lots of functionalities.
-
7,41380Released 7mo agoFree + from $5/mo
-
4,09752Released 2y agoFrom $8.99/mo
-
3,11834Released 1y ago100% Free
-
2,80328Released 11mo agoNo pricingThey couldn’t generate zebras without their stripes on 3 separate tries. That’s basic f-ing shit.
- Didn't find the AI you were looking for?
-
3,31150Released 3y ago100% Free
-
1,91026Released 2y agoFree + from $15/moGreat tool for getting some initial information about your data, especially in the beginning phase when your main goal is to explore your data
-
2,36237Released 1y ago100% Free
-
1,50515Released 2y agoFree + from $49/mo
-
1,149137v1 released 3y agoFrom $10.00
-
8463Released 2y agoNo pricing
-
7789Released 1y agoFree + from $10/mo
-
70312Released 1y agoFrom $39
-
64611Released 1y agoNo pricing
-
47818Released 1y agoFree + from $4.9/mo
-
12,38873153Released 2y ago100% FreeDumber than a box of hair. Asked for a break even analysis chart. Fed it clear fixed costs, variable costs, net operating income AND ROI percentages. Even hinted that the break even point was between years six and seven. Dude took five minutes to draw a line across the "0" plane labeled "costs" and a revenue line crossing through where I suggested the break even point is. The scale was between 0.2-1.6 USD. No, I am not running a business for ants.
-
19623Released 2y ago100% Free


Post


