Go to section
Spotlight![]() SureThing.io - "OpenClaw" for BeginnersTask automation
SureThing.io - "OpenClaw" for BeginnersTask automation
The front page of AI.Used by 90M+ humans.

Generate image
Tasks
Generate text
Free mode
Trending
Leaderboard
Characters
 Mini tools
New
Featured
Lists
Agents
Requests
Jobs
Map
Newsletter
Starter pack
Free tools
Speech to text
Text translator
Remove background
Settings
Edit profile
My tools
Gallery
Dashboard
Inbox
Get featured
Contact TAAFT
For you
Popular
Job impact index
Most saved
Affiliate program
Submit AI tool
Notification preferences
Glossary
Home
Timeline
My profile
Create tool
Deals
Companies
Models
Robots
Papers
Fundraises
Repositories
Devices
Organizations
Events
Prompt Pack
Merchendise
APIs
Features
Tools
Countries
Collections
Videos
Mini tools
New
Featured
Lists
Agents
Requests
Jobs
Map
Newsletter
Starter pack
Free tools
Speech to text
Text translator
Remove background
Settings
Edit profile
My tools
Gallery
Dashboard
Inbox
Get featured
Contact TAAFT
For you
Popular
Job impact index
Most saved
Affiliate program
Submit AI tool
Notification preferences
Glossary
Home
Timeline
My profile
Create tool
Deals
Companies
Models
Robots
Papers
Fundraises
Repositories
Devices
Organizations
Events
Prompt Pack
Merchendise
APIs
Features
Tools
Countries
Collections
Videos

▼ Latest
Stock chart
Free mode
100% free
Freemium
Free Trial
Featured matches
-
 Alex Huber🙏 32 karmaFeb 27, 2026@MiDash AII am planning to automate my trading system and customise an agent , I chatted with the support right from the dashboard they answered in 15 mins
 -
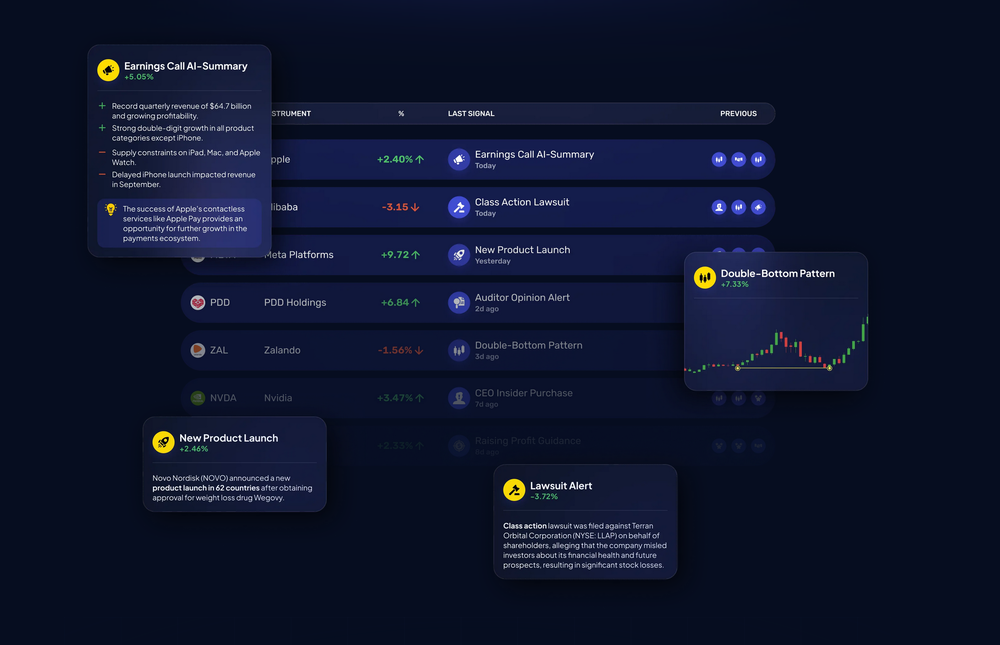 Ideal for stock-watchlist and not missing trade setups that correspond to my strategy.


Verified tools
-
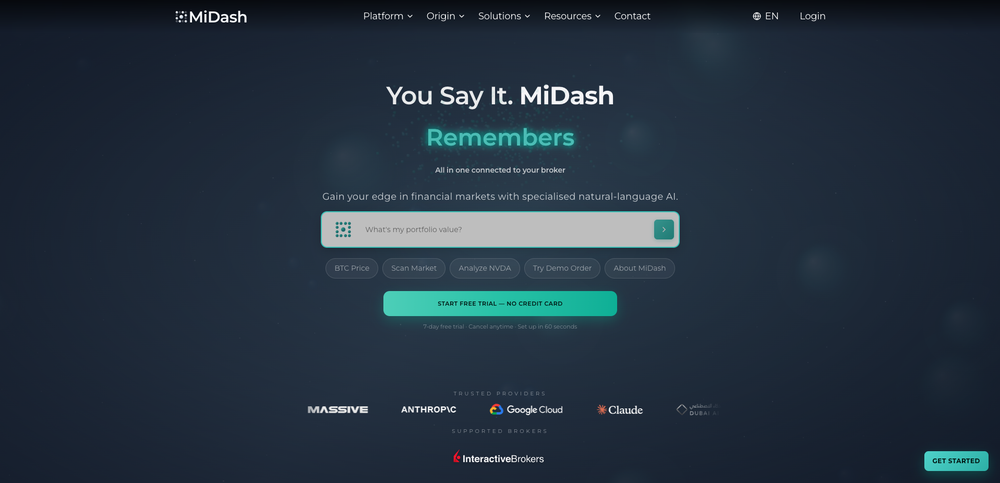
 Empower your investment strategies with AI signals, option flow data, and advanced chart patterns.OpenOver-priced for what it promises to do. Other AI powered services, at more affordable prices, or cheaper, some with incredible track records and scientists with great track records.
 -
This AI is awesome. You have to try it because it gives an amazing analysis on any stock. 10/10
-
-
OtterQuant provides natural language stock screening, AI analysis and alternative market data like congress trade tracking.
- Spotlight
 SureThing.io - "OpenClaw" for BeginnersTask automation
 -
It's an amazing tool that monitors my stocks with AI alerts and avoid reading junks.
-
 AI-powered financial analyst from Investing.com delivering market insights and researchOpen


Other tools
-
 Open
Open -
I was just trying to get a quick graph showing population evolution over the last 30 years, didn’t have the dataset ready, so I was hoping the tool could auto-fill something reasonable. But it literally gave me three values. Three?? For 30 years?? What kind of trend can I possibly see with that? If the tool offers to research the data, it should at least offer a full timeline. And when I pasted the data I found, it created a literally bar chart???
-
Very functional and has up to date pricing and good for technical analysis! Recent this app stop working out of nowhere smh.
- Didn't find the AI you were looking for?
-
Requires an account and doesn't even include single sign in. I'm negatively bias towards any app that doesn't include single sign in. Any modern app should have single sign in.
-
-
-
 Open
Open -
Dumber than a box of hair. Asked for a break even analysis chart. Fed it clear fixed costs, variable costs, net operating income AND ROI percentages. Even hinted that the break even point was between years six and seven. Dude took five minutes to draw a line across the "0" plane labeled "costs" and a revenue line crossing through where I suggested the break even point is. The scale was between 0.2-1.6 USD. No, I am not running a business for ants.


