Go to section
Spotlight![]() SureThing.io - "OpenClaw" for BeginnersTask automation
SureThing.io - "OpenClaw" for BeginnersTask automation
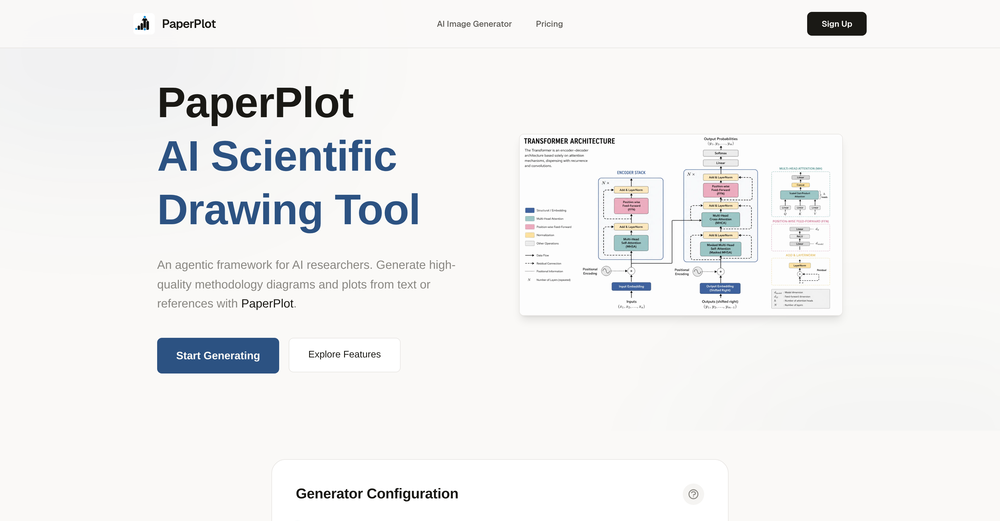
The front page of AI.Used by 90M+ humans.

TAAFT Tutorial
Generate image
Tasks
Generate text
Free mode
Trending
Leaderboard
Characters
 Mini tools
New
Featured
Lists
Agents
Requests
Jobs
Map
Newsletter
Starter pack
Free tools
Speech to text
Text translator
Remove background
Settings
Edit profile
My tools
Gallery
Dashboard
Inbox
Get featured
Contact TAAFT
For you
Popular
Job impact index
Most saved
Affiliate program
Submit AI tool
Notification preferences
Glossary
Home
Timeline
My profile
Create tool
Deals
Companies
Models
Robots
Papers
Fundraises
Repositories
Devices
Organizations
Events
Prompt Pack
Merchendise
APIs
Features
Tools
Countries
Collections
Videos
Mini tools
New
Featured
Lists
Agents
Requests
Jobs
Map
Newsletter
Starter pack
Free tools
Speech to text
Text translator
Remove background
Settings
Edit profile
My tools
Gallery
Dashboard
Inbox
Get featured
Contact TAAFT
For you
Popular
Job impact index
Most saved
Affiliate program
Submit AI tool
Notification preferences
Glossary
Home
Timeline
My profile
Create tool
Deals
Companies
Models
Robots
Papers
Fundraises
Repositories
Devices
Organizations
Events
Prompt Pack
Merchendise
APIs
Features
Tools
Countries
Collections
Videos

▼ Price
Visual data interpretation
Free mode
100% free
Freemium
Free Trial
Featured matches
-
 WEB5LAB🛠️ 3 tools 🙏 103 karmaJun 1, 2026@InfographicAIgood for creating posts
 -

Other tools
-
 Opentried it and skimmed a bunch of entries on dreams, animals and numbers. The write-ups tie symbols to headspace in a way that actually gets you thinking, a little horoscope-y at times but I still pulled a few solid lines for my journal
 - Spotlight
 SureThing.io - "OpenClaw" for BeginnersTask automation
 -
The infographic maker lets you use it once for free without signing in. This infographic maker is simple and easy to use, even more so than Canva or Venngage. However, the available styles and templates are still limited. I hope they add more design options and customization in future updates. Overall, a good choice for quickly creating infographics.
-
-
Says you can have 3 free per day without logging in, but wanted to charge for my first use
-
Hi Taaft community! I’m the creator of ConceptViz. We built this tool specifically for educators and researchers who deal with complex information daily. ConceptViz uses AI to instantly transform dense lesson plans, curriculum notes, or research frameworks into clear, structured diagrams. Our goal is to help K12 teachers make abstract concepts tangible for students and to help researchers map out logical workflows without the manual drudgery of drawing. I’d love to hear how this fits into your academic or classroom workflow—your feedback will help us build a better tool for the education community! 🚀
- Didn't find the AI you were looking for?
-
-
 Open
Open -
-
-
Looks promising but found it very slow to load and create templates and previews
-
I was just trying to get a quick graph showing population evolution over the last 30 years, didn’t have the dataset ready, so I was hoping the tool could auto-fill something reasonable. But it literally gave me three values. Three?? For 30 years?? What kind of trend can I possibly see with that? If the tool offers to research the data, it should at least offer a full timeline. And when I pasted the data I found, it created a literally bar chart???
-
I did not like it. Seems very generic and did not adapt or recognized the topic to change the figures and the templates. Simply put my text to templates not related to the topic.
-
I felt there is need of more ready made templates. But, it does what it claims. I chose one question suggested by the AI agent, and it created the infographics in few seconds. It's cool. Saving it for future reference.
-
 Create stunning hand-drawn flowcharts from text instantly.OpenI use AI Flowchart Generator to create flowcharts for my blog posts. It’s incredibly easy to use and saves me so much time. Now, I can turn my text to flowchart and make my posts more interesting and helpful for readers!
 -
They couldn’t generate zebras without their stripes on 3 separate tries. That’s basic f-ing shit.
-
-
 Pioneering expert in creative image analysis and synthesis.Open
 -
 Analyzing photos and creating new images from descriptions.Open
 -
 Advanced AI for in-depth analysis and summarization of articles.OpenProvides a basic summary in order for the reader to decide whether to delve deeper or not.
 -
 Advanced plant diagnosis with diverse capabilities and confidentiality.Open
 -
Dumber than a box of hair. Asked for a break even analysis chart. Fed it clear fixed costs, variable costs, net operating income AND ROI percentages. Even hinted that the break even point was between years six and seven. Dude took five minutes to draw a line across the "0" plane labeled "costs" and a revenue line crossing through where I suggested the break even point is. The scale was between 0.2-1.6 USD. No, I am not running a business for ants.
-
 Advanced white paper analysis with project comparison and trend insights.Open
 -
 Open
Open -
 Open
Open -


