

▼ Popular
Automated chart generator
Free mode
100% free
Freemium
Free Trial
Featured matches
-
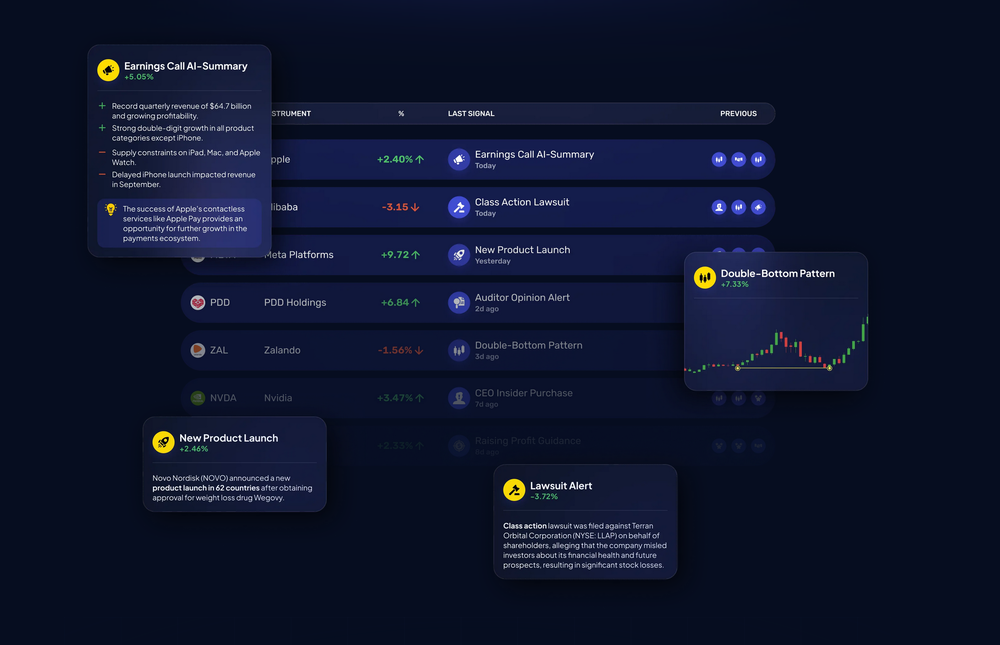 Now you can spot companies which are announcing new product launches that may significantly impact their future growth.
 -
 Alex Huber🙏 15 karmaFeb 27, 2026@MiDash AII am planning to automate my trading system and customise an agent , I chatted with the support right from the dashboard they answered in 15 mins
 -

-
 The infographic maker lets you use it once for free without signing in. This infographic maker is simple and easy to use, even more so than Canva or Venngage. However, the available styles and templates are still limited. I hope they add more design options and customization in future updates. Overall, a good choice for quickly creating infographics.


Other tools
-
-
This one was really nice. In that it could also generate a white paper to go with the diagram
-
- Sponsor
 KiloClaw - Managed 🦀 OpenClaw hosting
 -
Amazing presentations, and for free!!11
-
 AI-powered Excel analysis and visualization in natural languageOpenTired of wrestling with complex formulas, spending hours cleaning data, and struggling to create the right charts? Excelmatic is a powerful web-based AI agent designed to revolutionize your relationship with spreadsheets.
 -
It’s a powerful and intuitive tool that simplifies complex tasks, boosts productivity, and makes managing work smoother than ever. Highly recommended!
- Didn't find the AI you were looking for?
-
Great tool for getting some initial information about your data, especially in the beginning phase when your main goal is to explore your data
-
-
 AI infographic generator that turns blog posts into link magnetsOpen
 -
-
I was just trying to get a quick graph showing population evolution over the last 30 years, didn’t have the dataset ready, so I was hoping the tool could auto-fill something reasonable. But it literally gave me three values. Three?? For 30 years?? What kind of trend can I possibly see with that? If the tool offers to research the data, it should at least offer a full timeline. And when I pasted the data I found, it created a literally bar chart???
-
-
 Open
Open -
Says "free during testing," but keeps telling me I have insufficient credits. I also can't seem to find a way to delete my account.
-
Dumber than a box of hair. Asked for a break even analysis chart. Fed it clear fixed costs, variable costs, net operating income AND ROI percentages. Even hinted that the break even point was between years six and seven. Dude took five minutes to draw a line across the "0" plane labeled "costs" and a revenue line crossing through where I suggested the break even point is. The scale was between 0.2-1.6 USD. No, I am not running a business for ants.


Post


