

▼ Most saved
Histogram
Free mode
100% free
Freemium
Free Trial
Featured matches
-
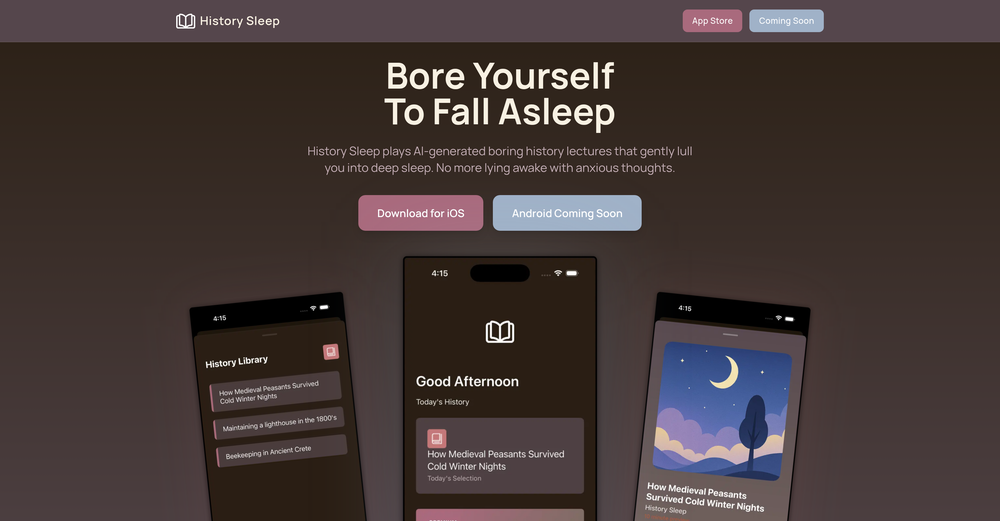 John Maskarinec🙏 3 karmaOct 19, 2025@History SleepWorks well for me. Give it a try.
 -

Other tools
-
As a UX Researcher - this is an amazing tool to rank and classify various user comments and feedback.
-
When I want to sign up on the Ideogram website with "Continue with Google" and press it, the sentence "Please choose an option to continue" appears below the banner and no action happens. Anybody can help me?
-
It took me less than 20 minutes to create infographic perfection- all the other AI design sites I tried, and I tried them all, weren't able to give me what I wanted in 1 way or another. Outline Ninja helped me create my infographic
-
- Sponsor:Rocket
-
I had to tweak a few things to match my brand style, but overall it saved me a ton of time. Definitely handy if you need something fast and professional-looking.
-
you have build an incorrect customer journey where you mostly feel user feel cheated and dissapointed as you dont even allow to try your product before payment. I wont use this tool again unless you change your model.
-
Great tool for getting some initial information about your data, especially in the beginning phase when your main goal is to explore your data
- Didn't find the AI you were looking for?
-
I was just trying to get a quick graph showing population evolution over the last 30 years, didn’t have the dataset ready, so I was hoping the tool could auto-fill something reasonable. But it literally gave me three values. Three?? For 30 years?? What kind of trend can I possibly see with that? If the tool offers to research the data, it should at least offer a full timeline. And when I pasted the data I found, it created a literally bar chart???
-
Dumber than a box of hair. Asked for a break even analysis chart. Fed it clear fixed costs, variable costs, net operating income AND ROI percentages. Even hinted that the break even point was between years six and seven. Dude took five minutes to draw a line across the "0" plane labeled "costs" and a revenue line crossing through where I suggested the break even point is. The scale was between 0.2-1.6 USD. No, I am not running a business for ants.


Post


