Go to section
Spotlight![]() SureThing.io - "OpenClaw" for BeginnersTask automation
SureThing.io - "OpenClaw" for BeginnersTask automation
The front page of AI.Used by 90M+ humans.

TAAFT Tutorial
Generate image
Tasks
Generate text
Free mode
Trending
Leaderboard
Characters
 Mini tools
New
Featured
Lists
Agents
Requests
Jobs
Map
Newsletter
Starter pack
Free tools
Speech to text
Text translator
Remove background
Settings
Edit profile
My tools
Gallery
Dashboard
Inbox
Get featured
Contact TAAFT
For you
Popular
Job impact index
Most saved
Affiliate program
Submit AI tool
Notification preferences
Glossary
Home
Timeline
My profile
Create tool
Deals
Companies
Models
Robots
Papers
Fundraises
Repositories
Devices
Organizations
Events
Prompt Pack
Merchendise
APIs
Features
Tools
Countries
Collections
Videos
Mini tools
New
Featured
Lists
Agents
Requests
Jobs
Map
Newsletter
Starter pack
Free tools
Speech to text
Text translator
Remove background
Settings
Edit profile
My tools
Gallery
Dashboard
Inbox
Get featured
Contact TAAFT
For you
Popular
Job impact index
Most saved
Affiliate program
Submit AI tool
Notification preferences
Glossary
Home
Timeline
My profile
Create tool
Deals
Companies
Models
Robots
Papers
Fundraises
Repositories
Devices
Organizations
Events
Prompt Pack
Merchendise
APIs
Features
Tools
Countries
Collections
Videos

▼ Price
Visualisation tool
Free mode
100% free
Freemium
Free Trial
Featured matches


Other tools
-
Matt Phelps🛠️ 1 tool 🙏 3 karmaFeb 10, 2026@BodyFatEstimator.aiestimate was in line with a recent DEXA scan
-
Says "free during testing," but keeps telling me I have insufficient credits. I also can't seem to find a way to delete my account.
- Spotlight
 SureThing.io - "OpenClaw" for BeginnersTask automation
 -
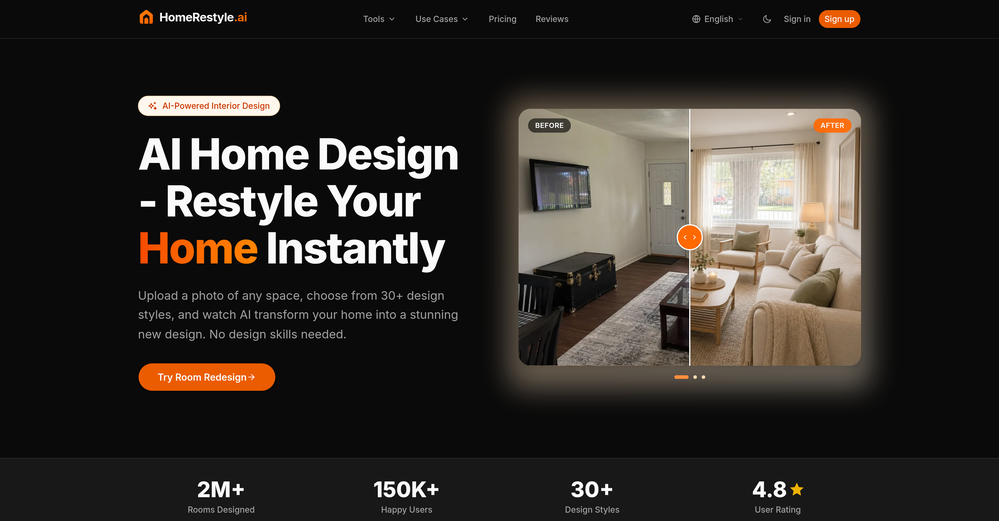
Easy to play around with, the options are pretty clear and it's nice for quick inspo, but, it's not the craziest tool though, since you can't really test it on your own room or make detailed changes. It's more like "hmm, what would a room like this look like?" Fun to try and the quality's nice, but not super practical.
-
Hi Taaft community! I’m the creator of ConceptViz. We built this tool specifically for educators and researchers who deal with complex information daily. ConceptViz uses AI to instantly transform dense lesson plans, curriculum notes, or research frameworks into clear, structured diagrams. Our goal is to help K12 teachers make abstract concepts tangible for students and to help researchers map out logical workflows without the manual drudgery of drawing. I’d love to hear how this fits into your academic or classroom workflow—your feedback will help us build a better tool for the education community! 🚀
-
It's helps you get started on a presentation. Likely need to edit photos and text.
-
Create and share Mermaid diagrams instantly in your browser
- Didn't find the AI you were looking for?
-
-
 Unlimited AI Clothing Generator — Design, Try-On & Fashion Video | WearMindOpen
 -
-
There is no image to see after giving prompt and generating
-
-
Was very useful for my class assignment. Very easy to edit on and the AI converts sketches into great wireframes.
-
-
No way to test it. Only paid options. The 7 days trial requires a credit card. this sounds as a scham
-
Looks promising but found it very slow to load and create templates and previews
-
 Get 5x more B2B meetings. Visual Radar replaces dead lead lists instantly.Open
 -
Great tool for getting some initial information about your data, especially in the beginning phase when your main goal is to explore your data
-
 Turn architectural sketches into photorealistic renders in seconds.Open
 -
I was just trying to get a quick graph showing population evolution over the last 30 years, didn’t have the dataset ready, so I was hoping the tool could auto-fill something reasonable. But it literally gave me three values. Three?? For 30 years?? What kind of trend can I possibly see with that? If the tool offers to research the data, it should at least offer a full timeline. And when I pasted the data I found, it created a literally bar chart???
-
asking for key, no usability without a paid subscription
-
 Streamline legal processes with AI-powered contract management.Open
 -
-
-
 Open
Open -
 Visualize home renovations instantly with AIOpen
 -
An experience you will be totally impressed with
-
 Creating thematic, atmosphere-rich Christmas villages.Open
 -
 See products in a visual transition from intact to exploded views.OpenCan somebody try this tool and post a video and show how it works?
 -
Dumber than a box of hair. Asked for a break even analysis chart. Fed it clear fixed costs, variable costs, net operating income AND ROI percentages. Even hinted that the break even point was between years six and seven. Dude took five minutes to draw a line across the "0" plane labeled "costs" and a revenue line crossing through where I suggested the break even point is. The scale was between 0.2-1.6 USD. No, I am not running a business for ants.


