

▼ Popular
Data visualization
Free mode
100% free
Freemium
Free Trial
Featured matches
-
32,922175v2.0 released 6mo agoFree + from $75/yr

-
42,37187Released 2mo agoFree + from $8/mo
 Wasel Alhodar🙏 73 karmaJul 15, 2025This is truly a wonderful experience that brings joy and delight.
 -
15,73137v2.2 released 17d agoFree + from $11.48/mo

-
1,23519Released 1mo agoNo pricing

-
8,548106Released 4d agoNo pricing
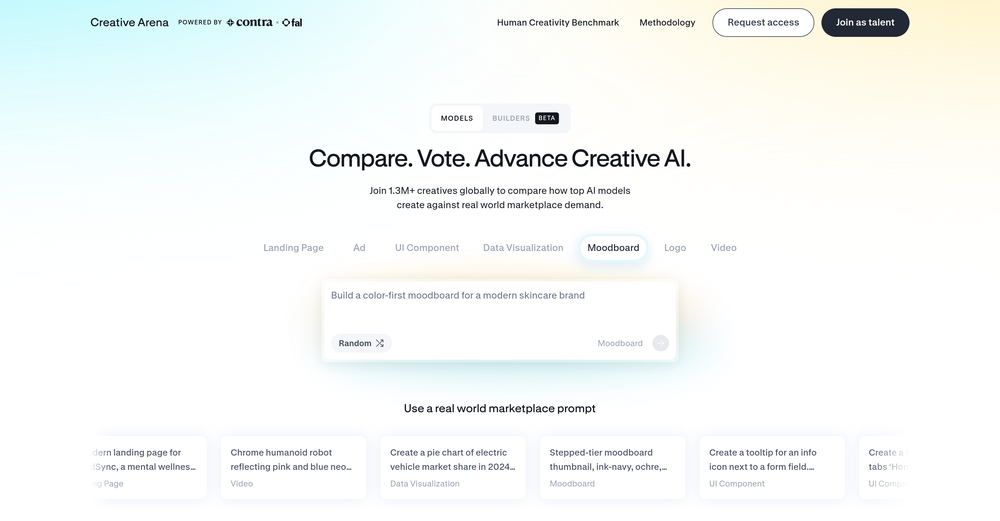 The leading generative media models on fal combined with top-earning real-world creative talent on Contra is a powerful combination. Feedback to fuel the future of creative ai.


Other tools
-
38,362983Released 2y agoFree + from $15/moIt is the ease of use for me. DataSquirrel is fast, the UI is super intuitive, and the guided analysis feature is highly convenient. I have officially moved from uploading CSV files from Google sheet to DataSquirrel. Within minutes, I can visualize my data and interpreting it becomes super simple.
-
44,251228Released 1y agoFrom $150
-
22,085160Released 2y agoFree + from $12/mo
-
14,269129Released 2y agoFree + from $16.77/moIt works for me, might’ve been a temporary issue. Give it another try!
- Sponsor:Rocket.new Vibe Coding
-
19,86585Released 2y agoNo pricingI really value the sentiment analysis tool—it simplifies understanding customer feedback by picking up on their emotions. Plus, the way it groups comments into topics is super helpful for decision-making.
-
7,948172Released 1y ago100% FreeI really like DataLine, but I'm kinda biased cause I built it.
-
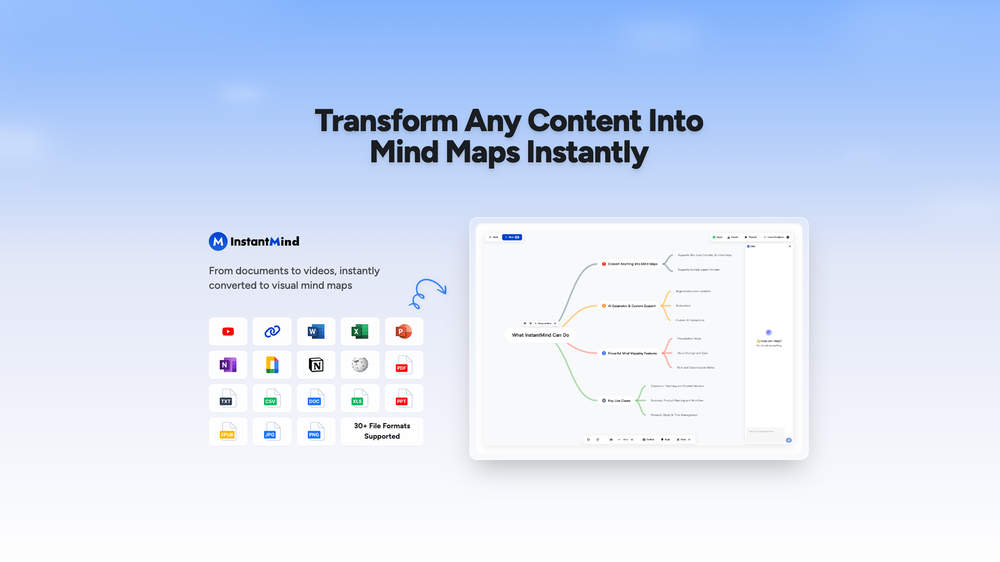
5,73941Released 2y agoFree + from $9.75/moI am able to summarize a complex paper into a one-pager visual. Before this tool: hours of reading and summarizing. After this tool: I grasp something complex in seconds. Thank you!!!
-
5,01950Released 1y agoFree + from $19/mo
-
3,32415Released 2y agoFree + from $420/mogreat in Slack or Teams to quickly fetch data and get visualizations
-
2,4309Released 2y agoNo pricing
-
2,45351Released 1y agoFree + from $10/mo
-
2,28425Released 1y agoFree + from $4.44/mo
- Didn't find the AI you were looking for?
-
25,52584Released 3mo ago100% FreeI felt there is need of more ready made templates. But, it does what it claims. I chose one question suggested by the AI agent, and it created the infographics in few seconds. It's cool. Saving it for future reference.
-
2,06923Released 1y agoNo pricing
-
1,82226Released 2y agoFree + from $15/moGreat tool for getting some initial information about your data, especially in the beginning phase when your main goal is to explore your data
-
1,79736Released 1y ago100% Free
-
1,75428Released 1y agoFrom $9/mo
-
1,6075Released 2y agoFree + from $12/mo
-
1,50619Released 1y agoFrom $35/mo
-
20,43923Released 2mo agoFree + from $20/moI was just trying to get a quick graph showing population evolution over the last 30 years, didn’t have the dataset ready, so I was hoping the tool could auto-fill something reasonable. But it literally gave me three values. Three?? For 30 years?? What kind of trend can I possibly see with that? If the tool offers to research the data, it should at least offer a full timeline. And when I pasted the data I found, it created a literally bar chart???
-
1,1534Released 2y agoFree + from $25/mo
-
8343Released 2y agoNo pricing
-
4993Released 22d agoFree + from $15/mo
-
38917Released 1y agoFree + from $25/mo
-
12,29173153Released 1y ago100% FreeDumber than a box of hair. Asked for a break even analysis chart. Fed it clear fixed costs, variable costs, net operating income AND ROI percentages. Even hinted that the break even point was between years six and seven. Dude took five minutes to draw a line across the "0" plane labeled "costs" and a revenue line crossing through where I suggested the break even point is. The scale was between 0.2-1.6 USD. No, I am not running a business for ants.
-
 Technical expert on Data Visualization and database integrationOpen78441Released 1y ago100% Free
 -
 Guides in choosing the right business data visualizations.Open6582Released 1y ago100% Free
 -
 Open6124100Released 1y ago100% Free


Post


