

▼ Most saved
Automatic chart generation
Free mode
100% free
Freemium
Free Trial
Featured matches
-
 AI-powered Excel analysis and visualization in natural languageOpen31,79140Released 2d agoFree + from $9.9/mo
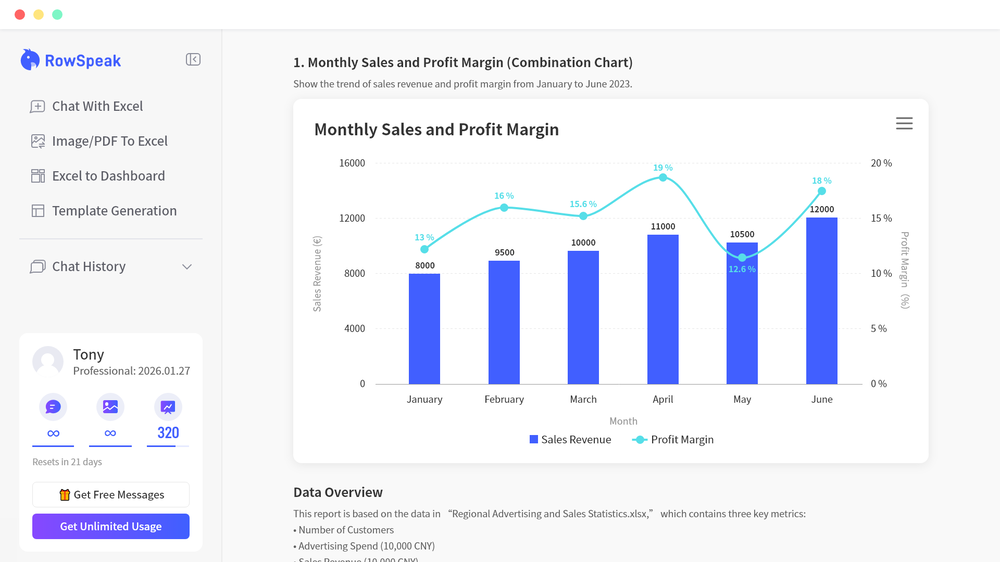 New Features & Improvements 1. New Dashboard Experience Added a powerful Dashboard feature. Users can now upload Excel or CSV files and get a clean, professional-looking data dashboard in just a few seconds. Automatically generates charts, key metrics, and summaries to help you understand your data at a glance. 2. Image/PDF to Table Conversion Added support for image-to-table conversion: turn table images into editable Excel data. Added support for PDF-to-table conversion: extract tabular data from PDFs into structured spreadsheets. Greatly reduces manual copy‑and‑paste work from screenshots and documents. 3. Faster, Smarter Data Processing Optimized the backend engine for faster response times. Improved data interpretation for more accurate and intelligent handling of complex tables and edge cases. Better performance for large files and multi-step transformations. 4. Enhanced Excel Editing & Data Cleaning Now supports editing Excel file styles, including formatting, cell styles, and layout adjustments. Added data cleaning tools to quickly remove duplicates, standardize formats, fix common errors, and tidy messy datasets. Makes it easier to go from raw data to polished, ready-to-use spreadsheets.
 -
1,0857Released 2mo agoFree + from $8/mo


Other tools
-
28,182296Released 8y ago100% Free
 Orit Paredes🛠️ 1 tool 🙏 57 karmaMay 2, 2025@Auto DrawIt works nicely. The autodraw function works really well, it easily detects what I’m trying to go for. W tool!
 -
26,872205Released 7mo agoFree + from $5/moThis one was really nice. In that it could also generate a white paper to go with the diagram
-
14,483164Released 2y agoFree + from $14/mo
-
22,414163Released 2y agoFree + from $12/mo
- Spotlight: Notis (Personal assistant)
-
14,300126Released 3y agoFree + from $9/moI want an impressive audit working papers, that show the audit program, and all audit samples with and steps done (ticks or symbols). They should enable the supervisor to track and assess the work of the team. This audit working paper should be interrelated and cover all accounting cycle and contain also the manufacturing cycle. It is worthwhile to be in the form of template in any file format (Pdf, word or excel).
-
16,20790Released 7mo agoFree + from $10/moI had to tweak a few things to match my brand style, but overall it saved me a ton of time. Definitely handy if you need something fast and professional-looking.
-
21,94086Released 2y agoNo pricingI really value the sentiment analysis tool—it simplifies understanding customer feedback by picking up on their emotions. Plus, the way it groups comments into topics is super helpful for decision-making.
-
6,07455Released 2y agoFree + from $168/yr
-
 Create stunning hand-drawn flowcharts from text instantly.Open3,58251Released 10mo agoNo pricingI use AI Flowchart Generator to create flowcharts for my blog posts. It’s incredibly easy to use and saves me so much time. Now, I can turn my text to flowchart and make my posts more interesting and helpful for readers!
 -
3,15049Released 9mo agoFree + from $4.99/mo
-
2,79438Released 1y ago100% Free
-
3,36733Released 2y agoFree + from $5.99/mo
- Didn't find the AI you were looking for?
-
1,81728Released 1y agoFrom $9/mo
-
1,95026Released 2y agoFree + from $15/moGreat tool for getting some initial information about your data, especially in the beginning phase when your main goal is to explore your data
-
1,66725Released 1y agoFree + from $9/mo
-
22,11824Released 4mo agoFree + from $20/moI was just trying to get a quick graph showing population evolution over the last 30 years, didn’t have the dataset ready, so I was hoping the tool could auto-fill something reasonable. But it literally gave me three values. Three?? For 30 years?? What kind of trend can I possibly see with that? If the tool offers to research the data, it should at least offer a full timeline. And when I pasted the data I found, it created a literally bar chart???
-
4,15521Released 2y ago100% Free
-
2,24419Released 1y agoFree + from $7/mo
-
1,53719Released 1y agoFree + from $19.99/mo
-
5,67718Released 2y agoFree + from $6.67/mo
-
16,68516Released 1mo agoFree + from $5/mo
-
14,97510Released 2mo agoFree + from $8/mo
-
7526Released 1y agoFree + from $2000
-
4,8064Released 3y agoFree + from $49/mo
-
8143Released 1y agoFree + from $15.46/mo
-
1,6231Released 2y agoFree + from $9/mo
-
1171Released 1d agoFree + from $7.9/mo
-
12,41275153Released 2y ago100% FreeDumber than a box of hair. Asked for a break even analysis chart. Fed it clear fixed costs, variable costs, net operating income AND ROI percentages. Even hinted that the break even point was between years six and seven. Dude took five minutes to draw a line across the "0" plane labeled "costs" and a revenue line crossing through where I suggested the break even point is. The scale was between 0.2-1.6 USD. No, I am not running a business for ants.


Post


