

▼ Most saved
Graphs
Free mode
100% free
Freemium
Free Trial
Featured matches
-
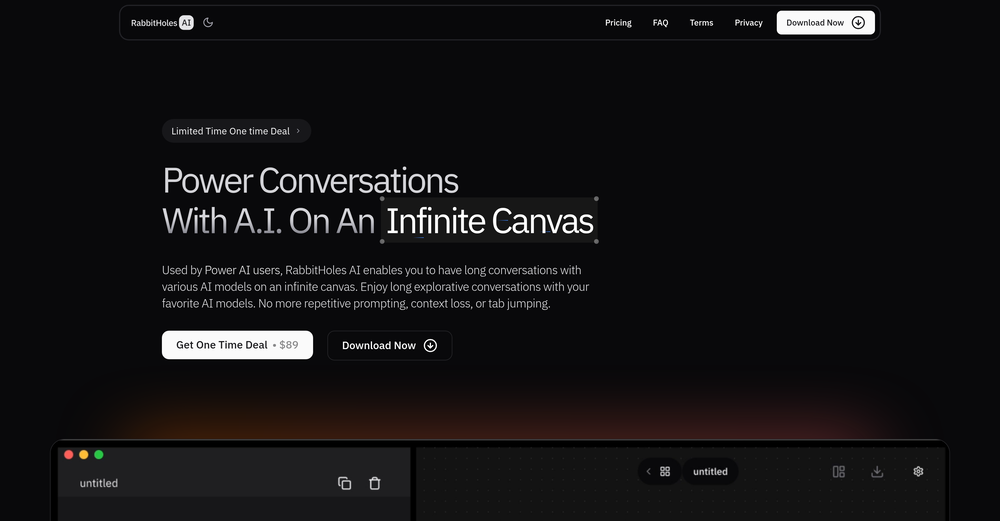
 Praneeth Pike🛠️ 1 tool 🙏 68 karmaApr 24, 2025@Rabbitholes AIYeah AI has ongoing cost. You have to purchase that model. But if you have a good computer, you can also use local models
 -

-
 It wouldn't create a werewolf or it's female victim. It takes forever to do anything. It's not worth it.
 -
-


Other tools
-
I wasn't able to use this one (I have my API key)
-
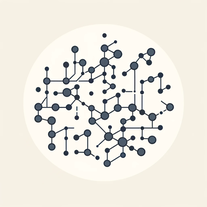
nice! does exatly what i wanted it to do, takes text, makes a nice looking diagram.
-
-
 Openquick n easy to use, great results with upscaling option. great tool. 5/5
 - Spotlight: CodeRabbit (Code reviews)
-
This one was really nice. In that it could also generate a white paper to go with the diagram
-
 AI-powered Instagram images that captivate and engage.Open
 -
 AI-powered viral graphic design for trending content.Open
 -
- Didn't find the AI you were looking for?
-
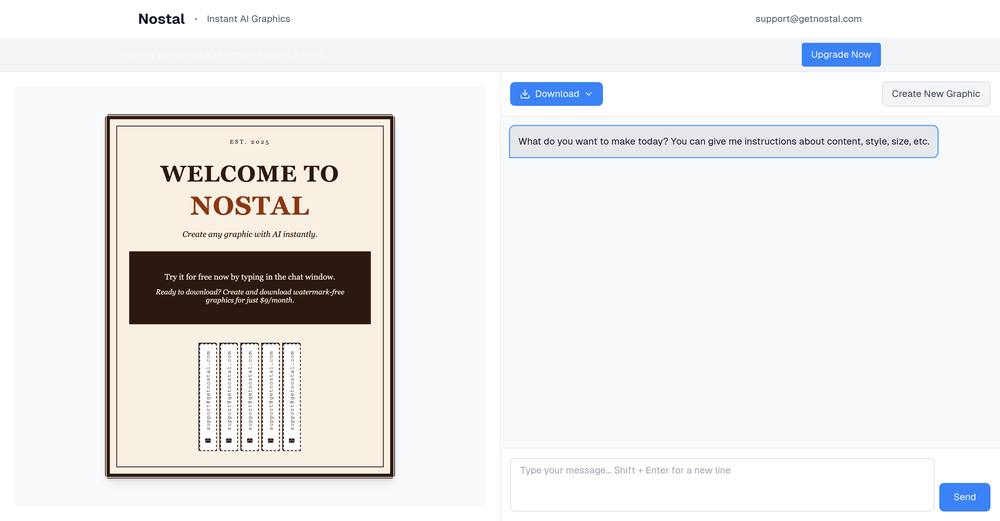
I had to tweak a few things to match my brand style, but overall it saved me a ton of time. Definitely handy if you need something fast and professional-looking.
-
I really value the sentiment analysis tool—it simplifies understanding customer feedback by picking up on their emotions. Plus, the way it groups comments into topics is super helpful for decision-making.
-
Isn't it possible that when downloading a diagram from it, the diagram to have white background rather than black background.
-
 Transform ideas into crisp, scalable digital illustrations.OpenChanged the prompt to improve results.
 -
 Open
Open -
poor tool doesn't take your prompts correctly i asked for specific colors and still gave me colors i didn't want even when asked not to.. waste of time
-
-
 Create stunning hand-drawn flowcharts from text instantly.OpenI use AI Flowchart Generator to create flowcharts for my blog posts. It’s incredibly easy to use and saves me so much time. Now, I can turn my text to flowchart and make my posts more interesting and helpful for readers!
 -
 Open
Open -
Looks promising but found it very slow to load and create templates and previews
-
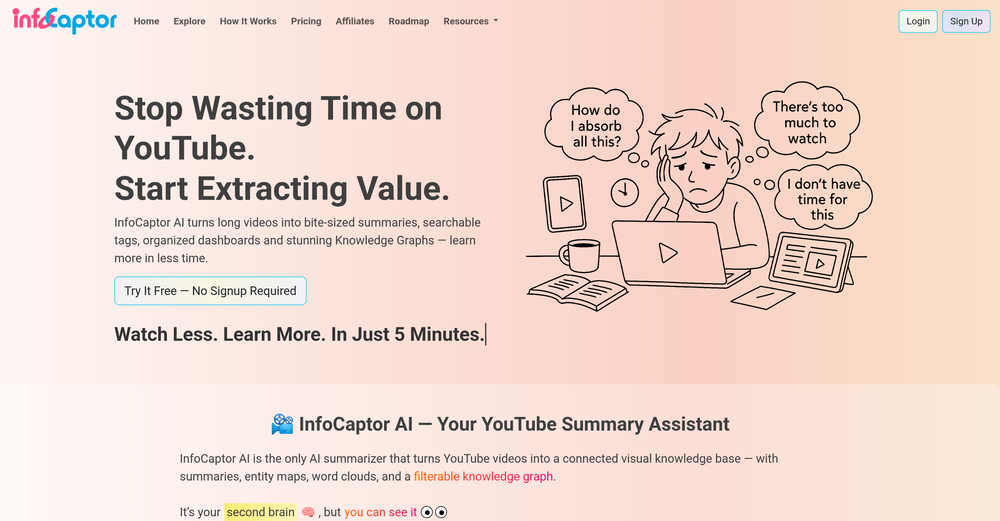
I am able to summarize a complex paper into a one-pager visual. Before this tool: hours of reading and summarizing. After this tool: I grasp something complex in seconds. Thank you!!!
-
 Create social media-ready visuals with perfect text rendering.Open
 -
Great tool for getting some initial information about your data, especially in the beginning phase when your main goal is to explore your data
-
I was just trying to get a quick graph showing population evolution over the last 30 years, didn’t have the dataset ready, so I was hoping the tool could auto-fill something reasonable. But it literally gave me three values. Three?? For 30 years?? What kind of trend can I possibly see with that? If the tool offers to research the data, it should at least offer a full timeline. And when I pasted the data I found, it created a literally bar chart???
-
Really interesting, user friendly and useful tool that saves a lot of time.
-
 AI-powered digital artist creating captivating holiday graphics.Open
 -
I got some free credits to try the app when I signed up, I could create a few great infographics
-
I want a logo for a traditional Persian carpet workshop in red color.
-
 Effortlessly design anything: presentations, logos, social media posts and more.OpenCanva is a user-friendly online design tool great for creating a variety of visuals like social media posts and presentations. Its drag-and-drop interface and vast template library make it ideal for those without design skills. While it's free for basic use, advanced features require a paid subscription. It simplifies design work and promotes collaboration, but professionals might find it less versatile than more sophisticated software. Overall, Canva is an excellent tool for quick, attractive designs.
 -
Dumber than a box of hair. Asked for a break even analysis chart. Fed it clear fixed costs, variable costs, net operating income AND ROI percentages. Even hinted that the break even point was between years six and seven. Dude took five minutes to draw a line across the "0" plane labeled "costs" and a revenue line crossing through where I suggested the break even point is. The scale was between 0.2-1.6 USD. No, I am not running a business for ants.
-
 Open
Open -
 Crafting custom cover images for your social media.Open
 -
 Open
Open -
 Open
Open -
 Open
Open -
 Open
Open -
 Transform into a news reporter with our AI tool that creates news articles, tweets, images, and graphs.Open
 -
 Automatically tile all professionals and equipment.Open
 -
 Helping beginners grasp OpenGL 4.6 concepts and terminology.Open
 -
 Helps beginners understand DirectX 11 concepts and terminology.Open
 -
 Demystifying DirectX 12 programming for beginners.Open
 -
 Open
Open -
 Helps beginners understand Vulkan concepts and terminology.Open
 -
 Open
Open -
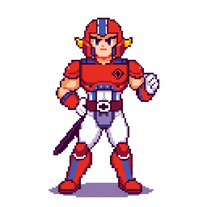
 Creating unique art from your photos and ideas.Open
 -
 Transforms your pee times into insightful graphs.Open
 -
 Structured financial analysis with investment advisory and simulations.Open


Post


