

▼ Most saved
Instant gantt charts
Free mode
100% free
Freemium
Free Trial
Featured matches
-
33,594102v3.0.0 released 3mo agoFree + from $39
-
 AI-powered task list: Dictate tasks, integrate with Gmail, Slack, ChatGPT & Calendar.Open8,52265Released 9mo agoFree + from $3.66/mo
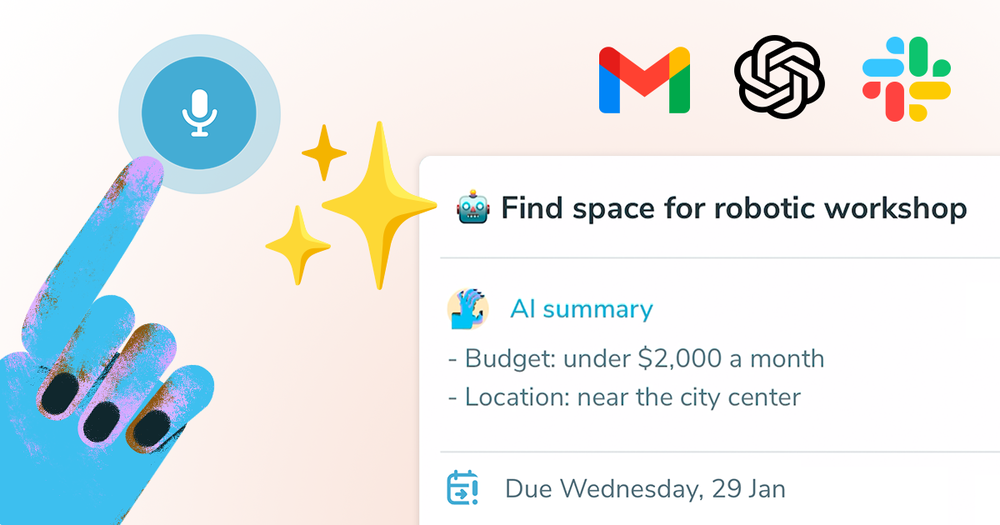
 Michael🙏 10 karmaJan 29, 2025@Ping: AI-Powered To Do ListEasy to use and the AI does its work but it is not something extraordinary. But the AI can do nothing more as it does right now
 -
1,0127Released 2mo agoFree + from $8/mo

Other tools
-
24,243373Released 2y agoFree + from $8/moUse full workspaces multiple people can use this ai
-
95,398164v1.1.4 released 4mo agoFree + from $5.99/moWhiteboard by Athena AI is a user-friendly, AI-powered tool that makes digital collaboration seamless. supports real-time brainstorming, and integrates easily with other apps—ideal for teams, educators, and remote learners alike.
-
22,318163Released 2y agoFree + from $12/mo
-
11,17191Released 2y agoFree + from $8/mo
- Sponsor:Rocket - Vibe Coding
-
 Open6,40548Released 2y agoFree + from $8/mo
 -
2,54241Released 2y agoFree + from $9.95/mo
-
5,30541Released 2y agoFree + from $9/mo
-
2,02839Released 1y agoFree + from $2.49/mo
-
2,43237Released 1y ago100% Free
-
3,28035Released 2y agoFrom $15/mo
-
4,06228Released 2y agoNo pricing
-
1,91626Released 2y agoFree + from $15/moGreat tool for getting some initial information about your data, especially in the beginning phase when your main goal is to explore your data
- Didn't find the AI you were looking for?
-
1,05724Released 1y agoFree + from $5/mo
-
21,65224Released 3mo agoFree + from $20/moI was just trying to get a quick graph showing population evolution over the last 30 years, didn’t have the dataset ready, so I was hoping the tool could auto-fill something reasonable. But it literally gave me three values. Three?? For 30 years?? What kind of trend can I possibly see with that? If the tool offers to research the data, it should at least offer a full timeline. And when I pasted the data I found, it created a literally bar chart???
-
1,10523Released 1y agoFree + from $20/mo
-
2,49420Released 2y agoFree + from $12.50/mo
-
1,50316Released 1y agoFree + from $19.99/mo
-
1,19411Released 2y agoFrom $85/yrLimitless possibilities, but templates available are subpar
-
1,1997Released 1y agoFree + from $1/mo
-
3423Released 1y agoFree + from $9/mo
-
6221Released 1y agoFree + from $5/mo
-
12,39173153Released 2y ago100% FreeDumber than a box of hair. Asked for a break even analysis chart. Fed it clear fixed costs, variable costs, net operating income AND ROI percentages. Even hinted that the break even point was between years six and seven. Dude took five minutes to draw a line across the "0" plane labeled "costs" and a revenue line crossing through where I suggested the break even point is. The scale was between 0.2-1.6 USD. No, I am not running a business for ants.


Post


