

▼ State of the art
Ai chart analysis
Free mode
100% free
Freemium
Free Trial
Other tools
-
46,879231Released 1y agoFrom $150Harishma Reghu🙏 7 karmaJan 13, 2024@Grapha AISuper useful tool that’s reduced my job by 80%
-
26,839205Released 7mo agoFree + from $5/moThis one was really nice. In that it could also generate a white paper to go with the diagram
-
22,406163Released 2y agoFree + from $12/mo
-
 Empower your investment strategies with AI signals, option flow data, and advanced chart patterns.Open15,640216Released 2y agoFree + from $49/moOver-priced for what it promises to do. Other AI powered services, at more affordable prices, or cheaper, some with incredible track records and scientists with great track records.
 - Spotlight: Speechmatics | AI Voice Agents (Voice agents)
-
14,594131Released 2y agoFree + from $16.77/moIt works for me, might’ve been a temporary issue. Give it another try!
-
21,86586Released 2y agoNo pricingI really value the sentiment analysis tool—it simplifies understanding customer feedback by picking up on their emotions. Plus, the way it groups comments into topics is super helpful for decision-making.
-
13,28697Released 2y agoFree + from $1
-
 AI spreadsheet & data analyst. 10x your productivity.Open25,996108Released 1mo agoFree + from $20/moI use our tool for cleaning data, research and writing scripts before a mail merge. Saves me hours.
 -
6,48746Released 1y agoFree + from $19.99/mo
-
6,06355Released 2y agoFree + from $168/yr
-
5,67318Released 2y agoFree + from $6.67/mo
-
5,21236Released 2y ago100% Free
- Didn't find the AI you were looking for?
-
4,14321Released 2y ago100% Free
-
4,13616Released 3y agoNo pricing
-
3,53327Released 2y ago100% Free
-
3,14149Released 9mo agoFree + from $4.99/mo
-
2,0889Released 2y agoFrom $39/mo
-
2,01328Released 2y agoFree + from $28/mo
-
1,94326Released 2y agoFree + from $15/moGreat tool for getting some initial information about your data, especially in the beginning phase when your main goal is to explore your data
-
2,76738Released 1y ago100% Free
-
1,87437Released 1y agoFree + from $9/mo
-
1,81128Released 1y agoFrom $9/mo
-
22,05824Released 4mo agoFree + from $20/moI was just trying to get a quick graph showing population evolution over the last 30 years, didn’t have the dataset ready, so I was hoping the tool could auto-fill something reasonable. But it literally gave me three values. Three?? For 30 years?? What kind of trend can I possibly see with that? If the tool offers to research the data, it should at least offer a full timeline. And when I pasted the data I found, it created a literally bar chart???
-
1,53519Released 1y agoFree + from $19.99/mo
-
1,34811Released 2y agoFrom $9.99/mo
-
 Open2,66916Released 6mo agoFree + from $9.99/mo
 -
1,33211Released 2y agoFrom $85/yrLimitless possibilities, but templates available are subpar
-
14,92310Released 2mo agoFree + from $8/mo
-
 Discover your cosmic connections worldwide through astrocartography.Open8146Released 2mo agoFree + from $9.9Eh it's ok. You only get one question to test it out and the quality of the info you get in that one message is too lackluster to warrant going back for more, especially if you're into astrology and already know basic stuff. The aesthetic is fine. Some of the buttons are inexplicably disabled and the tooltips conflict with one another on the map, making it irritating to try to interact with the lines rendered on the map.
 -
81116Released 1y agoFree + from $9/mo
-
77915Released 1y agoFree + from $19/mo
-
705168251Released 1y ago100% Free
-
5235Released 1y agoFree + from $18
-
62817Released 2y agoFree + from $25/mo
-
3395Released 2y agoNo pricing
-
12,41073153Released 2y ago100% FreeDumber than a box of hair. Asked for a break even analysis chart. Fed it clear fixed costs, variable costs, net operating income AND ROI percentages. Even hinted that the break even point was between years six and seven. Dude took five minutes to draw a line across the "0" plane labeled "costs" and a revenue line crossing through where I suggested the break even point is. The scale was between 0.2-1.6 USD. No, I am not running a business for ants.
-
8,93438Released 2y ago100% Free
-
 Python implementation guide for TradingView's Lorentzian Classification indicator.Open2,4993326Released 2y ago100% Free
 -
1,1022070Released 2y ago100% Free
-
86699Released 2y ago100% Free
-
79812100Released 2y ago100% Free
-
717662Released 2y ago100% Free
-
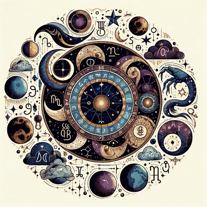 Upload your birth chart for personalized astrology.Open69614180Released 2y ago100% Free
 -
50711153Released 2y ago100% Free
-
268420Released 2y ago100% Free
-
23918Released 2y ago100% Free
-
168423Released 2y ago100% Free
-
12822Released 2y ago100% Free


Post


