Go to section
Spotlight![]() SureThing.io - "OpenClaw" for BeginnersTask automation
SureThing.io - "OpenClaw" for BeginnersTask automation
The front page of AI.Used by 90M+ humans.

Generate image
Tasks
Generate text
Free mode
Trending
Leaderboard
Characters
 Mini tools
New
Featured
Lists
Agents
Requests
Jobs
Map
Newsletter
Starter pack
Free tools
Speech to text
Text translator
Remove background
Settings
Edit profile
My tools
Gallery
Dashboard
Inbox
Get featured
Contact TAAFT
For you
Popular
Job impact index
Most saved
Affiliate program
Submit AI tool
Notification preferences
Glossary
Home
Timeline
My profile
Create tool
Deals
Companies
Models
Robots
Papers
Fundraises
Devices
Organizations
Events
Prompt Pack
Merchendise
APIs
Features
Tools
Countries
Collections
Videos
News
Investors
Repositories
Mini tools
New
Featured
Lists
Agents
Requests
Jobs
Map
Newsletter
Starter pack
Free tools
Speech to text
Text translator
Remove background
Settings
Edit profile
My tools
Gallery
Dashboard
Inbox
Get featured
Contact TAAFT
For you
Popular
Job impact index
Most saved
Affiliate program
Submit AI tool
Notification preferences
Glossary
Home
Timeline
My profile
Create tool
Deals
Companies
Models
Robots
Papers
Fundraises
Devices
Organizations
Events
Prompt Pack
Merchendise
APIs
Features
Tools
Countries
Collections
Videos
News
Investors
Repositories

▼ Latest
Graphical data
Free mode
100% free
Freemium
Free Trial
Featured matches
-
-

-

-
 WEB5LAB🛠️ 4 tools 🙏 103 karmaJun 1, 2026@InfographicAIgood for creating posts

Verified tools
-
 Open
Open -
Hi Federico, Thank you for taking the time to share your feedback. We truly appreciate all kinds of input as it helps us improve Amigo AI. If you'd like to explore the app further, we’d be more than happy to provide you with a redeem code for free access. Additionally, we're also open to sharing the code with the community if anyone is interested. Please let me know here, and I’ll share the coupon code with you directly! Love Amigo
-
- Spotlight
 SureThing.io - "OpenClaw" for BeginnersTask automation
 -
-
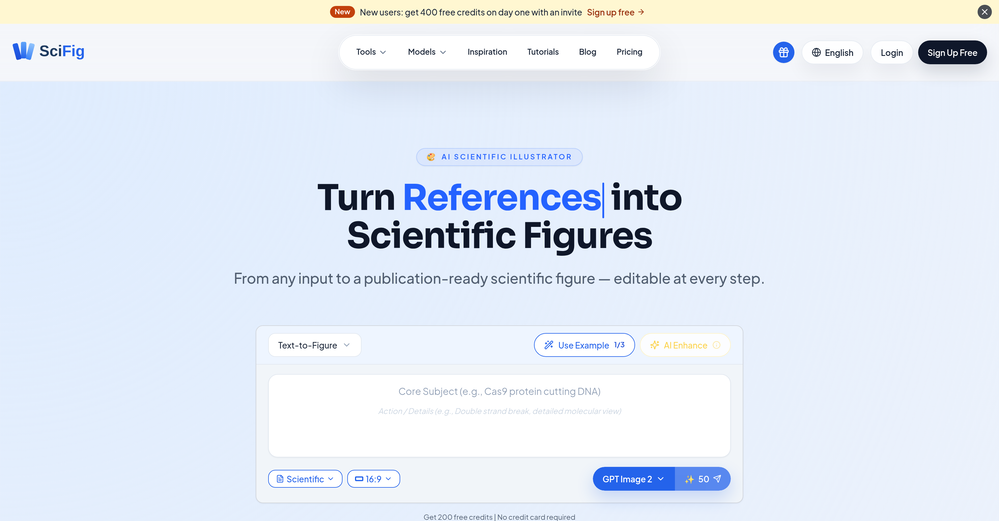
I did not like it. Seems very generic and did not adapt or recognized the topic to change the figures and the templates. Simply put my text to templates not related to the topic.
-
I really like DataLine, but I'm kinda biased cause I built it.
-
 Make Better Decisions with Data-Driven Charts, Clear Explanations, and Insightful AnalysisOpen
 -


Other tools
-
This one was really nice. In that it could also generate a white paper to go with the diagram
-
-
Great tool for getting some initial information about your data, especially in the beginning phase when your main goal is to explore your data
-
Says "free during testing," but keeps telling me I have insufficient credits. I also can't seem to find a way to delete my account.
- Didn't find the AI you were looking for?
-
I was just trying to get a quick graph showing population evolution over the last 30 years, didn’t have the dataset ready, so I was hoping the tool could auto-fill something reasonable. But it literally gave me three values. Three?? For 30 years?? What kind of trend can I possibly see with that? If the tool offers to research the data, it should at least offer a full timeline. And when I pasted the data I found, it created a literally bar chart???
-
It literally told me it couldn’t create maps, and directed me to Mapbox.
-
 Open
Open -
Dumber than a box of hair. Asked for a break even analysis chart. Fed it clear fixed costs, variable costs, net operating income AND ROI percentages. Even hinted that the break even point was between years six and seven. Dude took five minutes to draw a line across the "0" plane labeled "costs" and a revenue line crossing through where I suggested the break even point is. The scale was between 0.2-1.6 USD. No, I am not running a business for ants.


