Go to section
Spotlight![]() SureThing.io - "OpenClaw" for BeginnersTask automation
SureThing.io - "OpenClaw" for BeginnersTask automation
The front page of AI.Used by 90M+ humans.

Generate image
Tasks
Generate text
Free mode
Trending
Leaderboard
Characters
 Mini tools
New
Featured
Lists
Agents
Requests
Jobs
Map
Newsletter
Starter pack
Free tools
Speech to text
Text translator
Remove background
Settings
Edit profile
My tools
Gallery
Dashboard
Inbox
Get featured
Contact TAAFT
For you
Popular
Job impact index
Most saved
Affiliate program
Submit AI tool
Notification preferences
Glossary
Home
Timeline
My profile
Create tool
Deals
Companies
Models
Robots
Papers
Fundraises
Repositories
Devices
Organizations
Events
Prompt Pack
Merchendise
APIs
Features
Tools
Countries
Collections
Videos
Mini tools
New
Featured
Lists
Agents
Requests
Jobs
Map
Newsletter
Starter pack
Free tools
Speech to text
Text translator
Remove background
Settings
Edit profile
My tools
Gallery
Dashboard
Inbox
Get featured
Contact TAAFT
For you
Popular
Job impact index
Most saved
Affiliate program
Submit AI tool
Notification preferences
Glossary
Home
Timeline
My profile
Create tool
Deals
Companies
Models
Robots
Papers
Fundraises
Repositories
Devices
Organizations
Events
Prompt Pack
Merchendise
APIs
Features
Tools
Countries
Collections
Videos

▼ Most saved
Chart analysis
Free mode
100% free
Freemium
Free Trial
Featured matches
-
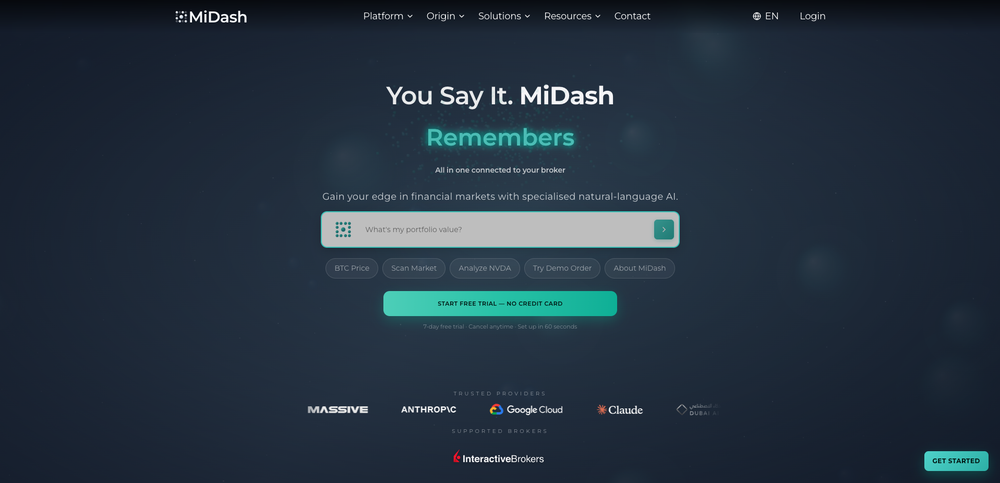 Alex Huber🙏 32 karmaFeb 27, 2026@MiDash AII am planning to automate my trading system and customise an agent , I chatted with the support right from the dashboard they answered in 15 mins
 -
 Open
Open
-

-
 Tired of wrestling with complex formulas, spending hours cleaning data, and struggling to create the right charts? Excelmatic is a powerful web-based AI agent designed to revolutionize your relationship with spreadsheets.
 -
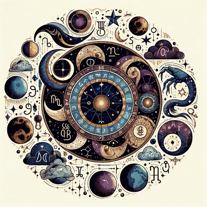
 Zi Wei Astrology makes ancient Chinese destiny analysis much easier to explore. The interface is clean, the chart experience feels structured, and the AI-guided reading helps translate complex Zi Wei Dou Shu ideas into something more practical for modern users. It is especially useful for people who are curious about life path, personality patterns, relationships, and long-term timing cycles but do not know how to read a traditional chart on their own. A strong concept with real potential.
 -
 AI astrology app for birth charts, horoscopes, compatibility, and life timing.Open
-
 Hi, Which type of user gets the most value from your platform? The reason I asked is because I like understanding who benefits the most from new products. Who's your ideal user?
 -
 Just type what you need — AI fills Sheets™, Docs™, and Slides™Open
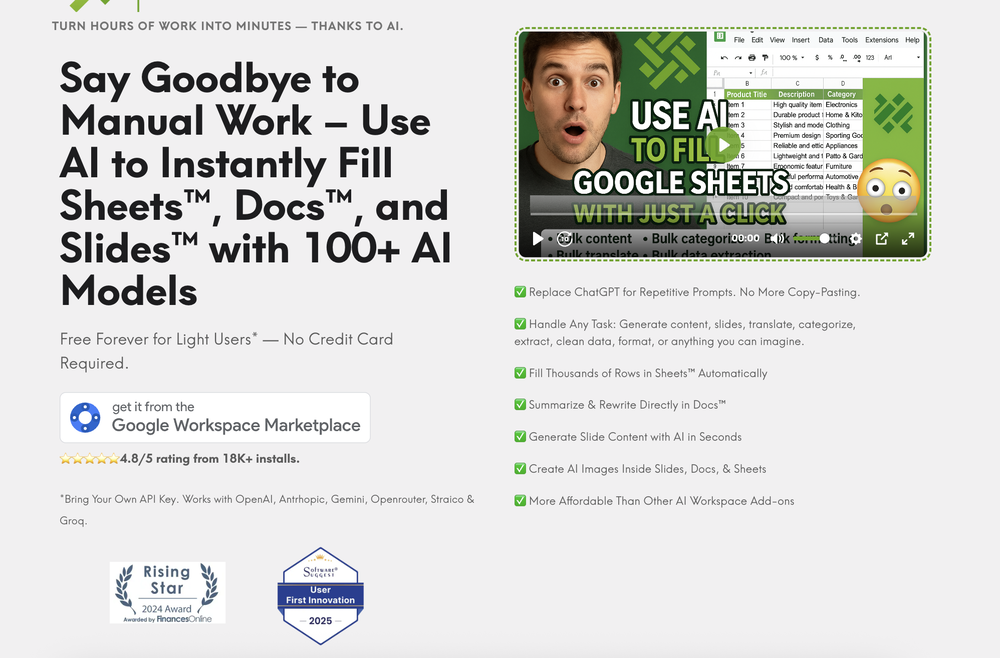 Just type what you need — AI fills Sheets™, Docs™, and Slides™. FREE Forever with your API key for up to 100 execution per month! Zero formula typing, natural language instructions, zero complexity. Fill spreadsheets, create and edit documents, generate slide presentations, create images, and more.
 -

-


Other tools
-
-
 Empower your investment strategies with AI signals, option flow data, and advanced chart patterns.OpenOver-priced for what it promises to do. Other AI powered services, at more affordable prices, or cheaper, some with incredible track records and scientists with great track records.
 -
This one was really nice. In that it could also generate a white paper to go with the diagram
- Spotlight
 SureThing.io - "OpenClaw" for BeginnersTask automation
 -
-
 AI spreadsheet & data analyst. 10x your productivity.OpenI use Sourcetable for quick data analysis and visualizations with natural-language queries. I'm working with Excel files and our Postgres database. It feels like an AI analyst built into a spreadsheet for turning raw data into clear reports. (Like ChatGPT + Excel, but better.)
 -
-
-
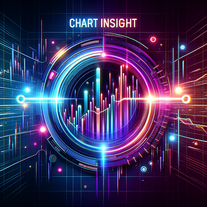
 Make Better Decisions with Data-Driven Charts, Clear Explanations, and Insightful AnalysisOpen
 - Didn't find the AI you were looking for?
-
I was just trying to get a quick graph showing population evolution over the last 30 years, didn’t have the dataset ready, so I was hoping the tool could auto-fill something reasonable. But it literally gave me three values. Three?? For 30 years?? What kind of trend can I possibly see with that? If the tool offers to research the data, it should at least offer a full timeline. And when I pasted the data I found, it created a literally bar chart???
-
Great tool for getting some initial information about your data, especially in the beginning phase when your main goal is to explore your data
-
-
-
 Open
Open -
Awesome. Helps me understand myself in simple terms!
-
I've been using Basquio as alpha tester and saved around 10 hours a week when doing slides since I started. My team at loamly.ai uses daily now. The depth of the analysis, as specialised agent is really impressive
-
Limitless possibilities, but templates available are subpar
-
Eh it's ok. You only get one question to test it out and the quality of the info you get in that one message is too lackluster to warrant going back for more, especially if you're into astrology and already know basic stuff. The aesthetic is fine. Some of the buttons are inexplicably disabled and the tooltips conflict with one another on the map, making it irritating to try to interact with the lines rendered on the map.
-
 Discover your life's secrets through professional palm reading analysis.Open
 -
Dumber than a box of hair. Asked for a break even analysis chart. Fed it clear fixed costs, variable costs, net operating income AND ROI percentages. Even hinted that the break even point was between years six and seven. Dude took five minutes to draw a line across the "0" plane labeled "costs" and a revenue line crossing through where I suggested the break even point is. The scale was between 0.2-1.6 USD. No, I am not running a business for ants.
-
 Python implementation guide for TradingView's Lorentzian Classification indicator.Open
 -
Not accurate, took multiple tries to get the correct information and only got it after feeding it directly.
-
 Upload your birth chart for personalized astrology.Open
 -
-
 Open
Open -
 Open
Open -
 Open
Open -
 Offers Bitcoin investment strategy insights based on chart data.Open
 -
 Decoding frequency response charts with ease.Open


