What is Instachart?
Instachart is a data visualization tool that instantly turns sketches, mockups, screenshots into interactive Luzmo dashboards.
How does Instachart work?
Instachart works by accepting various modes of input which can be either an upload of visuals or using a device's camera to capture images and sketches. It then transforms these inputs into interactive dashboards, enabling in-depth analysis and interpretation of data.
What types of data can be visualized using Instachart?
Instachart can visualize a wide variety of data, including cystic fibrosis research, employee training and assessment, sensor data, retail sales, and more.
How to upload visuals in Instachart?
To upload visuals in Instachart, users simply have to utilize the 'Upload screenshot' function available on their website.
Can I use the device's camera to input sketches into Instachart?
Yes, users can use their device's camera to input sketches into Instachart.
What applications does Instachart cover?
Instachart covers a diverse range of applications including but not limited to cystic fibrosis research, employee training and assessment, sensor data analysis, retail sales, and more.
How does Instachart handle cystic fibrosis research data?
Instachart handles cystic fibrosis research data by transforming visual data, such as sketches or screenshots, into interactive Luzmo dashboards, enabling a more accessible and in-depth analysis of the research data.
How can Instachart be used for employee training and assessment?
Instachart can be used for employee training and assessment by creating an interactive dashboard which can be utilized to assess and train employees more effectively and in a data-driven way.
Does Instachart support sensor data analysis?
Yes, Instachart does support sensor data analysis. It can transform sensor data visuals into interactive dashboards for more in-depth analysis.
Can Instachart be used for retail sales analysis?
Yes, Instachart can be used for retail sales analysis. It can transform retail sales data images or sketches into an interactive Luzmo dashboard to monitor and analyze sales.
What makes Instachart suited for diverse sectors and applications?
Instachart is suited for diverse sectors and applications because of its ability to transform a wide array of visual data into interactive and accessible Luzmo dashboards, catering to different needs of data analysis and interpretation.
How does Instachart transform sketches and screenshots into interactive dashboards?
Instachart utilizes its advanced image processing and sketch recognition technology to transform sketches and screenshots into interactive dashboards featuring intuitive design and functionality.
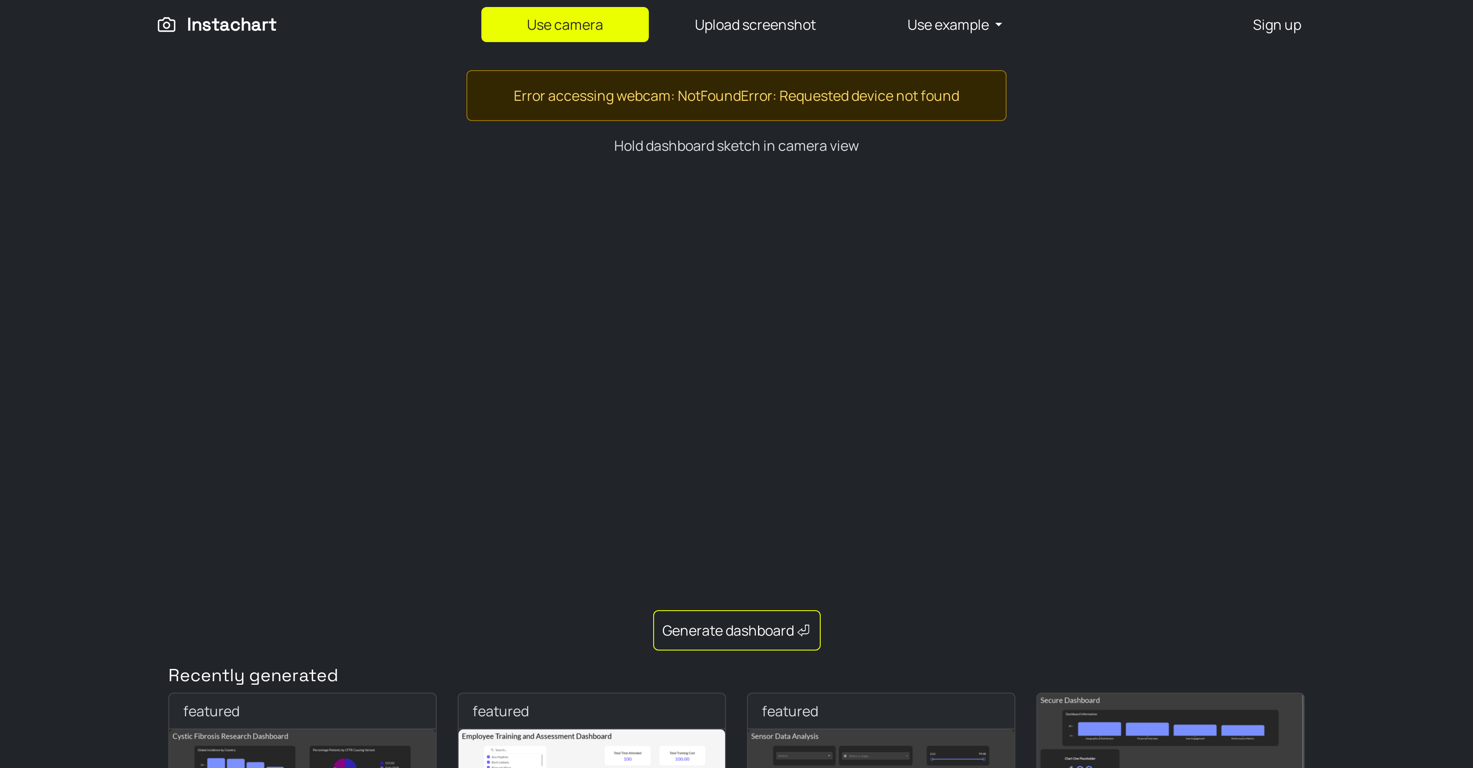
Is there an error option if webcam is not found in Instachart?
Yes, Instachart does provide an error option if the webcam is not found. The error is alerted as 'NotFoundError: Requested device not found'.
How does Instachart assist in data analysis?
Instachart assists in data analysis by enabling users to transform raw visual data or sketches into intuitive and interactive Luzmo dashboards, providing a comprehensive and insightful view of the data.
What are the features of Instachart's Luzmo dashboards?
The features of Instachart's Luzmo dashboards include intuitive design, interactivity, and the capability to provide a more in-depth and accessible analysis of data from a variety of sectors.
Can I sign up into Instachart?
Yes, users can sign up into Instachart using the 'Sign up' option on their website.
Does Instachart offer example data for practice?
Yes, Instachart does offer example data for practice. These can be accessed via the 'Use example' option on their website.
How to generate a dashboard in Instachart?
To generate a dashboard in Instachart, users have to capture an image of their sketch or upload a visual, then apply the 'Generate dashboard' function.
What are some recently generated dashboards in Instachart?
Some of the recently generated dashboards in Instachart include 'Cystic Fibrosis Research Dashboard', 'Employee Training and Assessment Dashboard', 'Sensor Data Analysis', 'Retail Sales Dashboard', and more.
What is the 'Creating your dashboard' function Powered by Luzmo in Instachart?
The 'Creating your dashboard' function in Instachart is a process where the platform transforms the uploaded visuals or scanned sketches into an interactive Luzmo dashboard. This function is powered by Luzmo, the underlying technology platform of Instachart.