

▼ Latest
Information visualization
Free mode
100% free
Freemium
Free Trial
Featured matches
-
 L Jenkins🙏 103 karmaAug 29, 2024@MyReportHow has this not received a single review. It’s a brilliant analytical writer of up to 5,000 words
 -
 I really gotta let my heart out, got so many great reviews from my peers. It has helped me make my school work so much easier. I work with little children so when i make it cartoonish it's giving me the best one's yet.
 -


Verified tools
-
This has got a super-positive future. After creating just one video, I could see that there would be a large use-case for most industries, including mine with Online Marketing. One thing I did notice was that assets that appear on screen often overlap each other. The same was apparent on most of the other videos in their showcase. Once they get over this hurdle, it'll be worth paying for, for sure.
-
 Turn Any Workshop Recording Into a Process Map in 60 SecondsOpenVery good. I like it
 -
- Sponsor
 Wispr Flow-Now on Android!🎤 Dictation
 -
-
I had to tweak a few things to match my brand style, but overall it saved me a ton of time. Definitely handy if you need something fast and professional-looking.
-
-
Hi Taaft community! I’m the creator of ConceptViz. We built this tool specifically for educators and researchers who deal with complex information daily. ConceptViz uses AI to instantly transform dense lesson plans, curriculum notes, or research frameworks into clear, structured diagrams. Our goal is to help K12 teachers make abstract concepts tangible for students and to help researchers map out logical workflows without the manual drudgery of drawing. I’d love to hear how this fits into your academic or classroom workflow—your feedback will help us build a better tool for the education community! 🚀
-
I felt there is need of more ready made templates. But, it does what it claims. I chose one question suggested by the AI agent, and it created the infographics in few seconds. It's cool. Saving it for future reference.
-
I got some free credits to try the app when I signed up, I could create a few great infographics


Other tools
-
 Create pro LinkedIn carousels in seconds, no design skills needed.OpenThis is an awesome tool for creating content very fast. I use it daily for my LinkedIn posts. However, you need to be crystal clear about what you actually want from it. Superb tool!
 -
It easy to use and you can create beautiful presentations but you can't share professionally without a HUGE cost of 50 per month thats billed annual! they try and force you to buy. Will not use as it is NOT easy to share
-
 Create stunning hand-drawn flowcharts from text instantly.OpenI use AI Flowchart Generator to create flowcharts for my blog posts. It’s incredibly easy to use and saves me so much time. Now, I can turn my text to flowchart and make my posts more interesting and helpful for readers!
 - Didn't find the AI you were looking for?
-
Such a powerful tool with free account, all your data analysis needs with an easy intuitive itnerface
-
"Key Milestones in the Y2K Phenomenon and the Rise of OpenAI": This was result of simply prompting it "Y2K, OpenAI". The results were excellent. I imagine this would be an amazing tool for a large basket of professionals, as well as scholars and more.
-
I couldn't really use it because it was more of an extension of ChatGPT. It asked for the API key, making it clear it wasn't an independent summarization tool. I feel like I could just go into ChatGPT and do the exact same thing. I'm looking for an independent platform focused on automatically summarizing and note-taking for students, but this seems more like an add-on rather than a standalone solution.
-
I am able to summarize a complex paper into a one-pager visual. Before this tool: hours of reading and summarizing. After this tool: I grasp something complex in seconds. Thank you!!!
-
-
Good to use even for free. Gives answers related directly to the info in the document, along with references to pages where it can be found. Also does well at analyzing graphs and charts
-
-
Works really great and easy way to create a chat bot but .Ost importantly to control the Questions and Answers
-
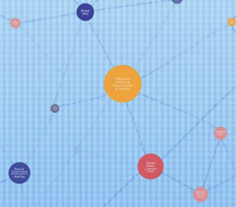
Combines knowledge graphs with AI, reveals main topics and gaps in a discourse.
-
It does exactly what is expected and more. I asked it to create a map with pins for 30 addresses and it did exactly that within a few seconds. It has great customization options also.
-
Parsers VC is an amazing tool that helps me predict investments and find the best venture matches. It has a lot of useful data and filters that make my research easier and faster. I’m very impressed by it!👏
-
I was just trying to get a quick graph showing population evolution over the last 30 years, didn’t have the dataset ready, so I was hoping the tool could auto-fill something reasonable. But it literally gave me three values. Three?? For 30 years?? What kind of trend can I possibly see with that? If the tool offers to research the data, it should at least offer a full timeline. And when I pasted the data I found, it created a literally bar chart???
-
-
It took me less than 20 minutes to create infographic perfection- all the other AI design sites I tried, and I tried them all, weren't able to give me what I wanted in 1 way or another. Outline Ninja helped me create my infographic
-
 Open
Open -
Hi Christian! Looks like it's working for me, can you give it another try?
-
 Refines articles into summaries and mind maps.Open
 -
 Your strategic advisor for business management decisions and insights.Open
 -
-
 Advanced assistant for data publication and integration.Open
 -
 Open
Open


Post


