
Generate image
Tasks
Generate text
Free mode
Trending
Leaderboard
Characters
 Mini tools
New
Featured
Lists
Agents
Requests
Jobs
Map
Newsletter
Starter pack
Free tools
Speech to text
Text translator
Remove background
Settings
Edit profile
My tools
Gallery
Dashboard
Inbox
Get featured
Contact TAAFT
For you
Popular
Job impact index
Most saved
Affiliate program
Submit AI tool
Notification preferences
Glossary
Home
Timeline
My profile
Create tool
Deals
Companies
Models
Robots
Papers
Fundraises
Repositories
Devices
Organizations
Events
Prompt Pack
Merchendise
APIs
Features
Tools
Countries
Collections
Videos
Mini tools
New
Featured
Lists
Agents
Requests
Jobs
Map
Newsletter
Starter pack
Free tools
Speech to text
Text translator
Remove background
Settings
Edit profile
My tools
Gallery
Dashboard
Inbox
Get featured
Contact TAAFT
For you
Popular
Job impact index
Most saved
Affiliate program
Submit AI tool
Notification preferences
Glossary
Home
Timeline
My profile
Create tool
Deals
Companies
Models
Robots
Papers
Fundraises
Repositories
Devices
Organizations
Events
Prompt Pack
Merchendise
APIs
Features
Tools
Countries
Collections
Videos

▼ Price
Workflow visualization
Free mode
100% free
Freemium
Free Trial
Featured matches
-
 Zain Saeed🙏 3 karmaMay 20, 2026@Team PulseI started using Team Pulse recently, and I really like how simple it feels. Managing projects, tasks, and pipelines in one place is smooth, clean, and easy to understand without overcomplicating the workflow.
 -
 The fastest way to map and streamline inefficient workflowsOpen
-

-

-

-

-
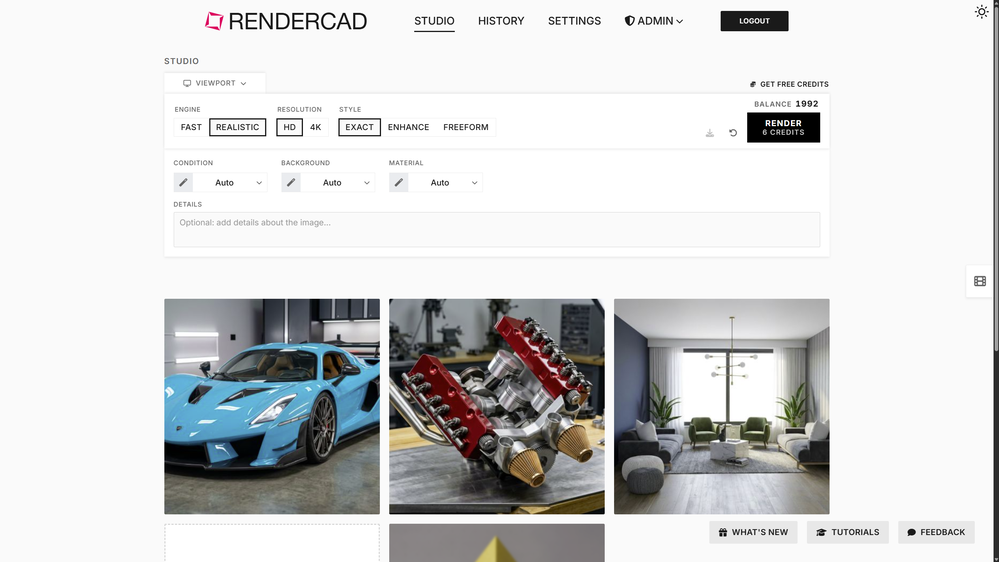 RenderCAD has been such an incredible asset to my company, At Home By Design. We specialize in both commercial and residential design, and their renderings have truly brought my visions to life. The level of detail, professionalism, and presentation has been beyond impressive.
 -

-

-


Other tools
-
it's wild how MLflow takes chaotic experiments and turns them into neat, tweakable apps.it's open source, dead-simple to install and crazy fast at loggin metrics. kudos to the dev :D
-
Isn't it possible that when downloading a diagram from it, the diagram to have white background rather than black background.
- Spotlight
 Acedly AIJob interviews
 -
Didn't really do the graphs that i thought it would do. Good for simple graphs, like for a presentation
-
Hi Taaft community! I’m the creator of ConceptViz. We built this tool specifically for educators and researchers who deal with complex information daily. ConceptViz uses AI to instantly transform dense lesson plans, curriculum notes, or research frameworks into clear, structured diagrams. Our goal is to help K12 teachers make abstract concepts tangible for students and to help researchers map out logical workflows without the manual drudgery of drawing. I’d love to hear how this fits into your academic or classroom workflow—your feedback will help us build a better tool for the education community! 🚀
- Didn't find the AI you were looking for?
-
Actually solid for product visuals. Uploaded a basic product photo and got a few usable lifestyle-style options without much setup. Having image and video tools in one place is handy, especially for testing listing ideas. I’d just like a clearer view of credit usage before running larger batches.
-
Whiteboard by Athena AI is a user-friendly, AI-powered tool that makes digital collaboration seamless. supports real-time brainstorming, and integrates easily with other apps—ideal for teams, educators, and remote learners alike.
-
 Open
Open -
 Open
Open -
Looks like an interesting project with complete focus on ease of use and no-code environment! 🤩 #NoCode #Project #Software #Development #EaseOfUse
-
Prepare as per blooms taxonomy question and answer for this Introduction, meaning, nature, scope of HRM-Importance and Evolution of the concept of HRM-Major functions of HRM-Principles of HRM, Factors of Competitive advantage, Nature and responsibility of HR Manager in Hospitals
-
 Open
Open -
Was very useful for my class assignment. Very easy to edit on and the AI converts sketches into great wireframes.
-
it works great and super fast with great attention to details and just enhances the interior to a great extend just like a professsional.
-
Seems great. Just setup an account to try it out. Basically bounced ideas off it for SOPs for a fire department and it actually does a wonderful job.
-
Looks promising but found it very slow to load and create templates and previews
-
-
 AI render enhancer built for archviz professionals.Open
 -
I've been using Basquio as alpha tester and saved around 10 hours a week when doing slides since I started. My team at loamly.ai uses daily now. The depth of the analysis, as specialised agent is really impressive
-
Scrollsequence is a game-changer for interactive storytelling! Smooth animations, intuitive setup, and impressive control over scrolling sequences make it perfect for engaging web experiences. Highly recommend for designers and developers looking to elevate their sites. 🙌
-
-
-
I run an early-stage startup. Arka has been pretty amazing for understanding our user adoption data (and then be able to ask follow up questions) in just a few clicks!
-
I was just trying to get a quick graph showing population evolution over the last 30 years, didn’t have the dataset ready, so I was hoping the tool could auto-fill something reasonable. But it literally gave me three values. Three?? For 30 years?? What kind of trend can I possibly see with that? If the tool offers to research the data, it should at least offer a full timeline. And when I pasted the data I found, it created a literally bar chart???
-
 Ask data questions, get instant insights, SQL, and charts — all poweredOpen
 -
Limitless possibilities, but templates available are subpar
-
 10X AI Adoption with Your Change Management Copilot; for digital transformation consultantsOpen
 -
Displayr has become an essential tool for survey data analysis. By leveraging advanced AI integration, the platform offers a user-friendly, low-code solution for analyzing survey data. Users can efficiently create presentations while working on data analysis within the same interface, eliminating the hassle of transferring numbers from Excel to PowerPoint.
-
Good to use even for free. Gives answers related directly to the info in the document, along with references to pages where it can be found. Also does well at analyzing graphs and charts
-
-
First AI data app I see that can connect databases and my GA4/Shopify APIs at the same time. Highly recommend if you have an ecommerce store!
-
-
 Create stunning hand-drawn flowcharts from text instantly.OpenI use AI Flowchart Generator to create flowcharts for my blog posts. It’s incredibly easy to use and saves me so much time. Now, I can turn my text to flowchart and make my posts more interesting and helpful for readers!
 -
-
 Guiding software development with Kanban methodologies.Open
 -
 Open
Open


